Pair: OM/USDT (MANTRA) | Timeframe: 15-min
Recent High: $0.06141 | Current Price: $0.05815 (-4.30% in 24h)
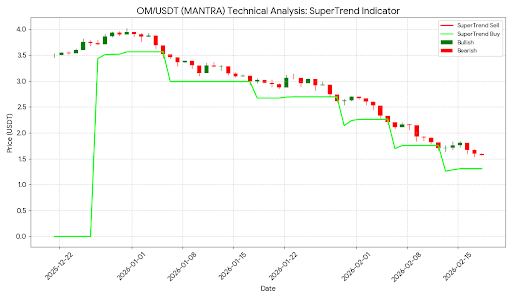
1. Trend Indicators: SuperTrend & Price Action
SuperTrend (10,3) shows red sell signal.
Price trading below resistance cloud.
Series of lower highs and lower lows → bears control micro-trend.
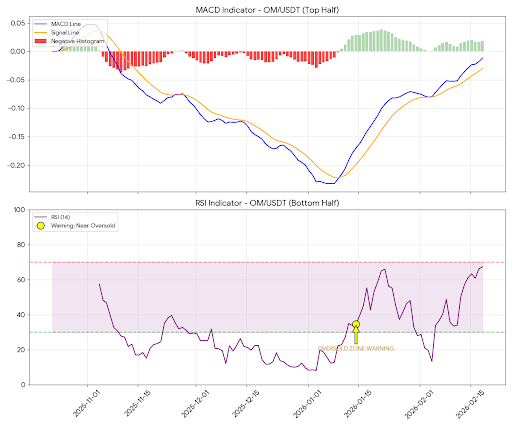
2. Momentum Analysis: MACD & RSI
MACD: Histogram in negative territory, DIF & DEA flattening. No bullish crossover yet.
RSI: 32.34 → near oversold (30). Selling pressure may be overextended, but no buy signal until RSI >40 or bullish divergence confirmed.
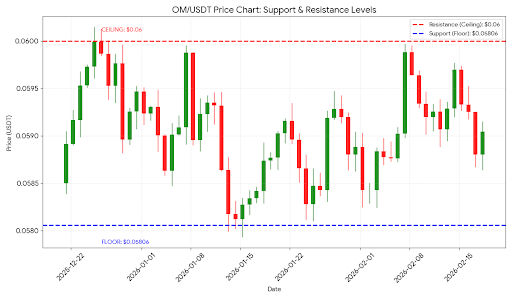
3. Key Levels to Watch
Immediate Support: $0.05806. Critical to maintain above $0.0570 zone.
Resistance: $0.05891 (SuperTrend) & $0.0600 (psychological barrier).
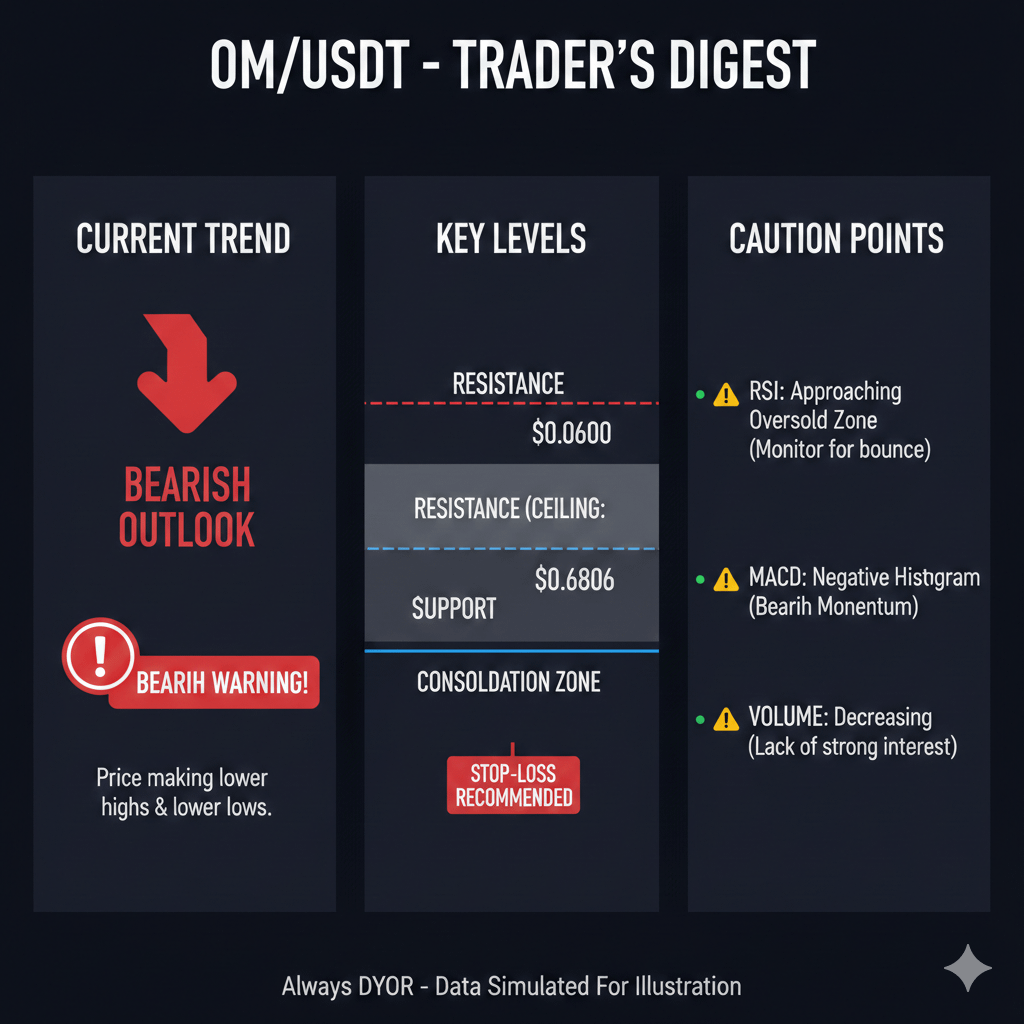
4. Summary for Traders
Outlook: Cautiously bearish.
RSI suggests discount zone, but no MACD reversal yet.
Wait for confirmed breakout or double-bottom formation at $0.0580 before considering long positions.
Risk Management: Always use stop-loss to protect capital.
Trade $OM here..👇

#OMUSDT
#CryptoAnalysis
#CryptoTrading
#TechnicalAnalysis
#Altcoins
Follow me for more news and updates 👇
Scan this Qr.code and get rewards!