At a current price of $1,966, Ethereum finds itself at a technically critical crossroads. While short-term volatility may tempt aggressive traders, the broader market structure tells a far more sobering story — one that disciplined investors cannot afford to ignore.
Across every single timeframe — from the 5-minute chart all the way to the monthly — ETH is aligned in a clear, uninterrupted downtrend. This kind of full-timeframe bearish synchronization is rare, and when it appears, it often precedes extended downside continuation rather than quick reversals.
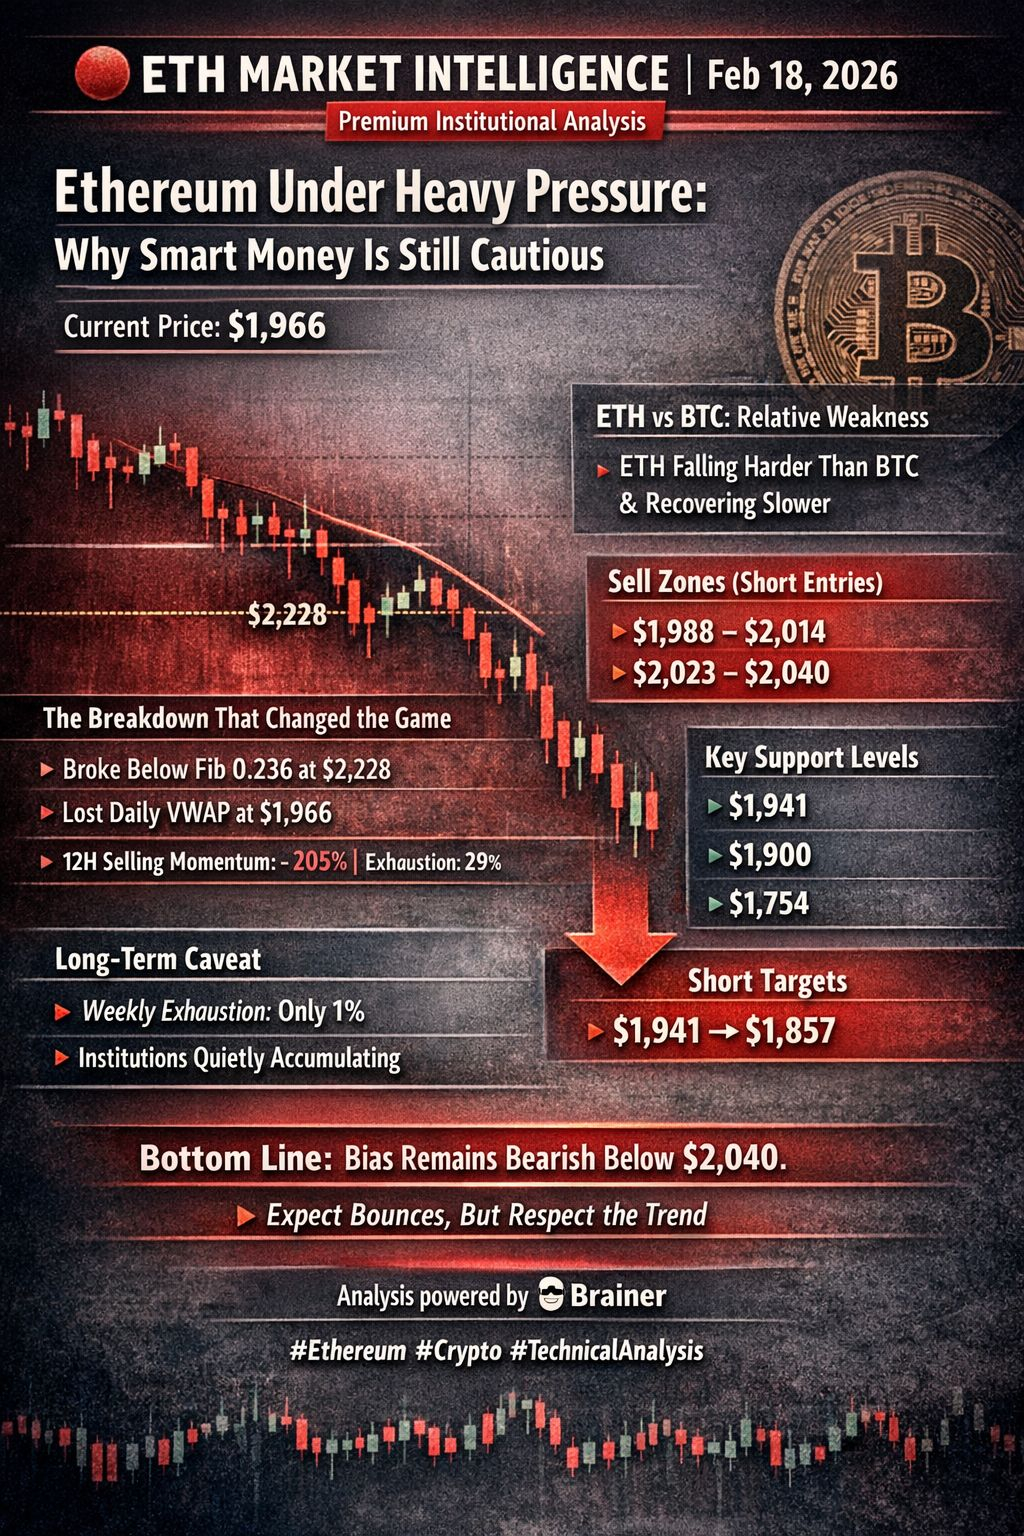
The Breakdown That Changed the Game
The latest monthly candle delivered a double technical blow:
A decisive break below Fib 0.236 at $2,228
A clean loss of Daily VWAP at $1,966
These two levels failing in the same candle on the highest timeframe is a textbook signal of structural weakness. It suggests that long-term participants are distributing risk, not accumulating aggressively — at least for now.
Meanwhile, 12H selling momentum sits at an extreme -205%, with exhaustion at just 29%. Translation?
👉 Sellers are not finished. The dominant swing participants still have fuel left, and downside pressure remains unresolved.
$ETH vs $BTC : A Red Flag Investors Watch Closely
Another key factor weighing on sentiment is ETH’s persistent underperformance against Bitcoin. Historically, when ETH lags BTC during risk-off phases, it tends to:
Fall harder during drawdowns
Recover slower once markets stabilize
This relative weakness reinforces the bearish thesis and reduces the probability of a sustainable upside move in the near term.
Strategic Trading Outlook: Where Smart Shorts Focus
Rather than chasing price lower, professional traders are watching for controlled relief rallies into defined resistance zones:
🔴 Sell Zones (Short Entries)
$1,988 – $2,014 → Primary short zone
$2,023 – $2,040 → High-conviction short if reached
As long as ETH remains below $2,040, rallies are statistically selling opportunities, not trend reversals.
Downside Targets & Structural Support
🟢 Key Support Levels
$1,941 → First reaction zone
$1,900 → Psychological & liquidity level
$1,754 → Major structural support
🎯 Short Targets
$1,941 → $1,857
These levels align with historical demand pockets where volatility-driven reactions are likely — though not necessarily long-term bottoms.
The One Caveat Long-Term Investors Should Watch
Despite the overwhelmingly bearish structure, there is one subtle but important signal beneath the surface:
Weekly exhaustion: just 1%
Quiet institutional accumulation visible on the monthly timeframe
This does not invalidate the downtrend. However, it does increase the probability of sharp, fast relief bounces — the kind that punish late shorts before the next leg lower unfolds.
In other words:
📌 Volatility risk is rising — even within a bearish regime.
Bottom Line: Bias Remains Clear
ETH is in a confirmed downtrend across all major timeframes, underperforming BTC and breaking key long-term levels. Until price can reclaim and hold above $2,040, the path of least resistance remains lower.
📉 Trend traders: stay with the downside bias
📊 Investors: patience is critical — structure has not reset
⚠️ Everyone: expect violent bounces, but respect the trend
Bias stays bearish below $2,040.
Analysis powered by Brainer