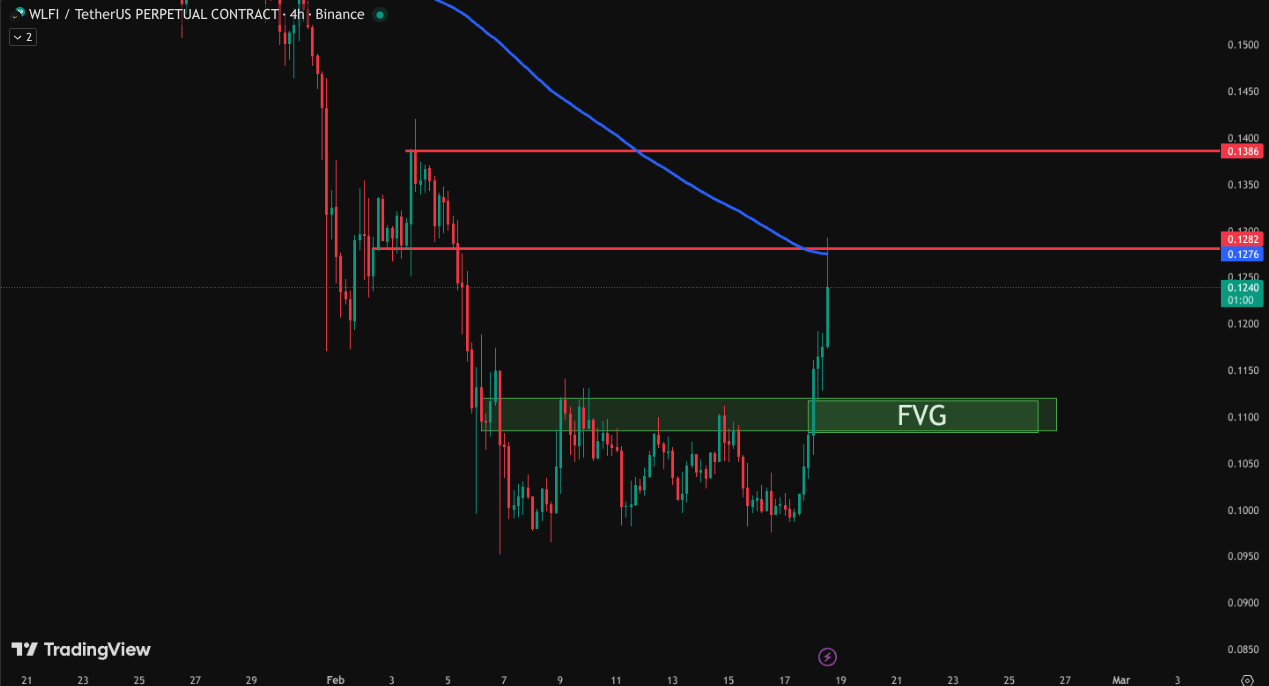
$WLFI has just delivered a technically significant move that traders should not ignore.
After breaking above a key Supply Zone, price successfully flipped that area into a Demand Zone — a classic market structure shift that signals bullish strength. This kind of supply-to-demand flip often confirms that sellers have been absorbed and buyers are now in control.
But here’s where it gets interesting…
📌 The Current Situation
After the breakout, WLFI rallied upward and tapped into a major resistance level.
At the same time, price touched the 200 EMA, creating a strong confluence zone.
And what happened?
A rejection candle formed with a clear upper wick, showing selling pressure exactly at resistance + 200 EMA confluence.
Now the big question:
👉 Is this just a temporary rejection before another breakout?
👉 Or are we about to see a deeper pullback before continuation?
🧠 Technical Breakdown
1️⃣ Supply → Demand Flip (Bullish Structure Shift)
When price breaks a supply zone and holds above it, that zone often becomes demand.
This indicates:
Buyers absorbed previous sell orders
Market sentiment shifted bullish
Smart money likely positioned earlier
If price holds above this flipped demand zone, continuation remains valid.
2️⃣ Resistance + 200 EMA Confluence
The 200 EMA is widely respected by institutions and swing traders.
When resistance aligns with the 200 EMA, it creates:
Liquidity grab potential
Rejection probability
High-volatility reaction zone
The rejection wick suggests sellers defended this area — but one candle is not confirmation of trend reversal.
🔍 Possible Scenarios
🟢 Scenario 1: Breakout Continuation
If price:
Consolidates tightly below resistance
Holds above flipped demand
Shows bullish volume increase
Then we may see a strong breakout above resistance + 200 EMA, leading to momentum expansion.
This would confirm:
✔ Rejection was weak
✔ Buyers are accumulating
✔ Breakout loading phase
🔴 Scenario 2: Deeper Pullback Before Continuation
If price:
Breaks back below flipped demand
Shows strong bearish momentum
Fails to reclaim 200 EMA
Then a correction toward lower support levels could occur before the next leg up.
This would likely be:
🔁 Healthy retracement
🧲 Liquidity sweep
📊 Reset before continuation
🎯 What I’m Watching
Volume reaction near 200 EMA
Structure on lower timeframes
Reaction at flipped demand zone
Liquidity sweep above resistance
No confirmation yet — market is at decision point.
⚠ Risk Reminder
Confluence increases probability — not certainty.
Always wait for confirmation and manage risk properly.