$ESP just delivered a strong +35% move, and this rally is not random. Let’s break it down step by step so you clearly understand what happened and what could come next.
📍 Phase 1: Initial Spike & Correction 📉
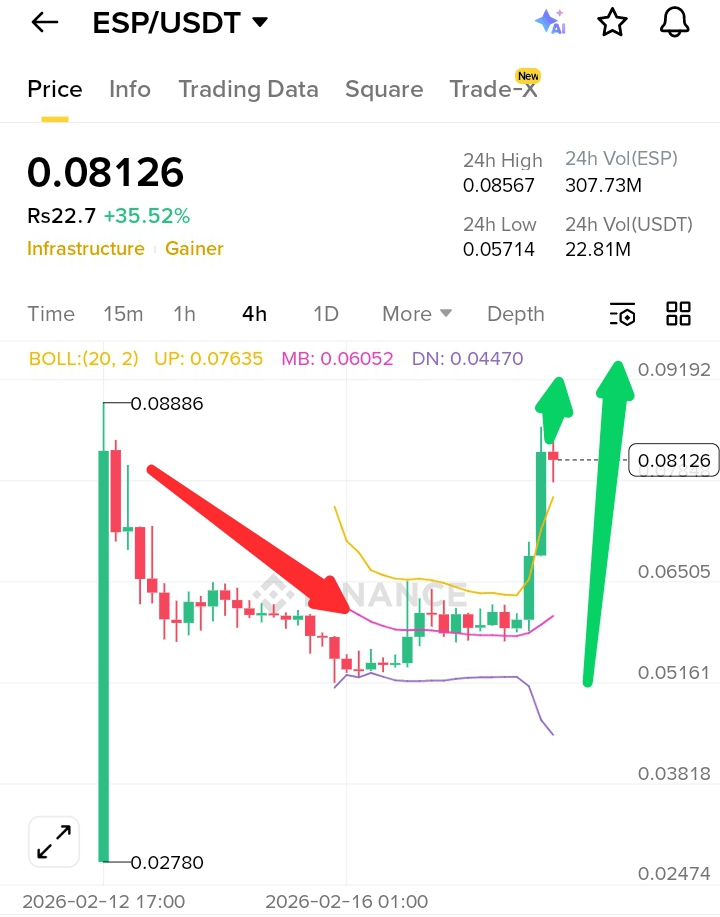
Price first made a sharp vertical move toward 0.0888, then immediately entered a controlled pullback. This wasn’t weakness — it was profit-taking. After fast pumps, early buyers usually secure gains, creating temporary downside pressure.
📍 Phase 2: Sideways Accumulation 🔄
After the dump, $ESP moved sideways in a tight range near 0.05–0.06. This is where smart money often accumulates. Volatility compressed, candles became smaller, and Bollinger Bands tightened — a classic sign that a bigger move was building.
📍 Phase 3: Volatility Expansion Breakout 🚀
Now we see the real move. Price exploded above the mid Bollinger Band and broke short-term resistance with strong momentum. 24h volume surged significantly (over 300M ESP), confirming real participation — not just thin liquidity movement. When volume expands with breakout structure, continuation probability increases.
📍 What Happens Next? 🤔
As long as $ESP holds above the 0.075–0.078 breakout zone, bullish structure remains intact. If buyers maintain dominance, the next upside attempt could test previous highs near 0.09 and potentially extend further. However, after a strong expansion, short-term consolidation is normal before continuation.
📊 Market Structure Summary
Downtrend → Accumulation → Breakout → Expansion
Currently in: Expansion Phase 📈
If volume continues increasing and higher lows form, upside continuation becomes more likely. If price falls back below reclaimed support, we may see temporary cooling before the next attempt.
 ESP0.07324+23.32%
If this roadmap helped you understand the move clearly, make sure to LIKE 👍 and FOLLOW 🔔 for more structured market breakdowns. I post analysis that keeps you ahead of the crowd.