
Two weeks ago I wrote a quick take predicting a short bullish movement for Bitcoin in the short term.
https://cryptoquant.com/insights/quicktake/6964daad4c7a21121994fd73
Indeed, Bitcoin price moved from $90K towards $97.5K after that.
Now, it's a good time for a wider and long range into Bitcoin through the lenses of different investors. This analysis synthesizes four critical on-chain and exchange-based metrics to explain why the price is currently struggling to maintain its momentum.
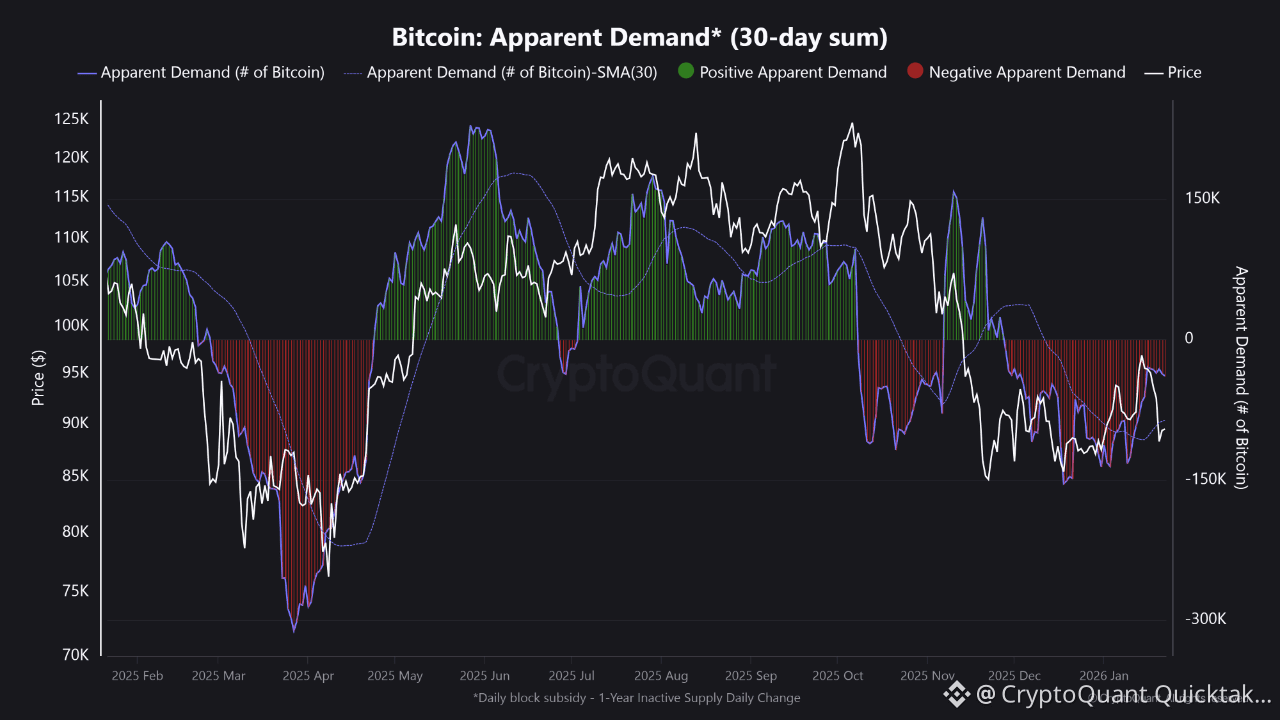
Firstly, Bitcoin Apparent Demand chart shows a stark transition from the high-demand "green" period of mid-2025 to a sustained red period or negative demand in January 2026. This suggests that "old hands" are distributing their coins faster than the market can absorb them, creating a supply overhang that is weighing on the price.
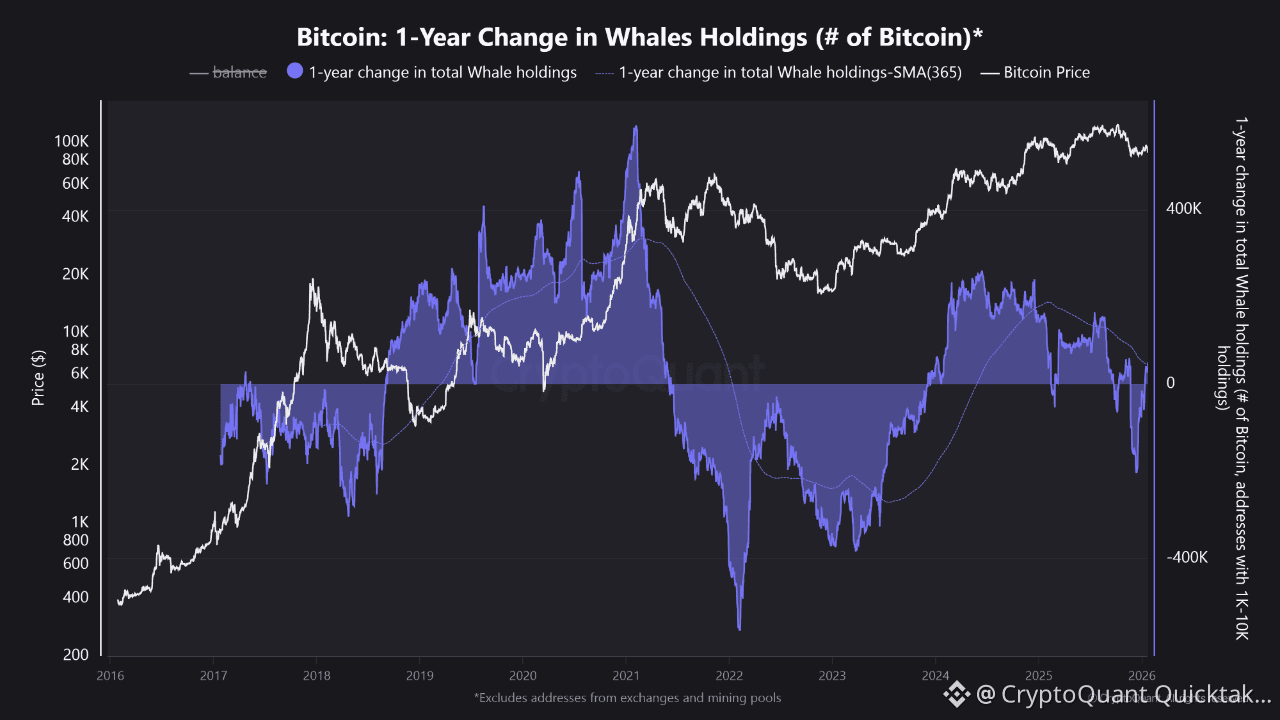
Secondly, Bitcoin: 1 Year Change in Whale (addresses holding 1K to 10K BTC) holdings chart shows that whales accumulated heavily throughout 2024 and early 2025. However, as of January 2026, the 1-year change is turning negative. Historically, when the blue area shrinks or goes negative, it signals that the largest players are exiting the market.
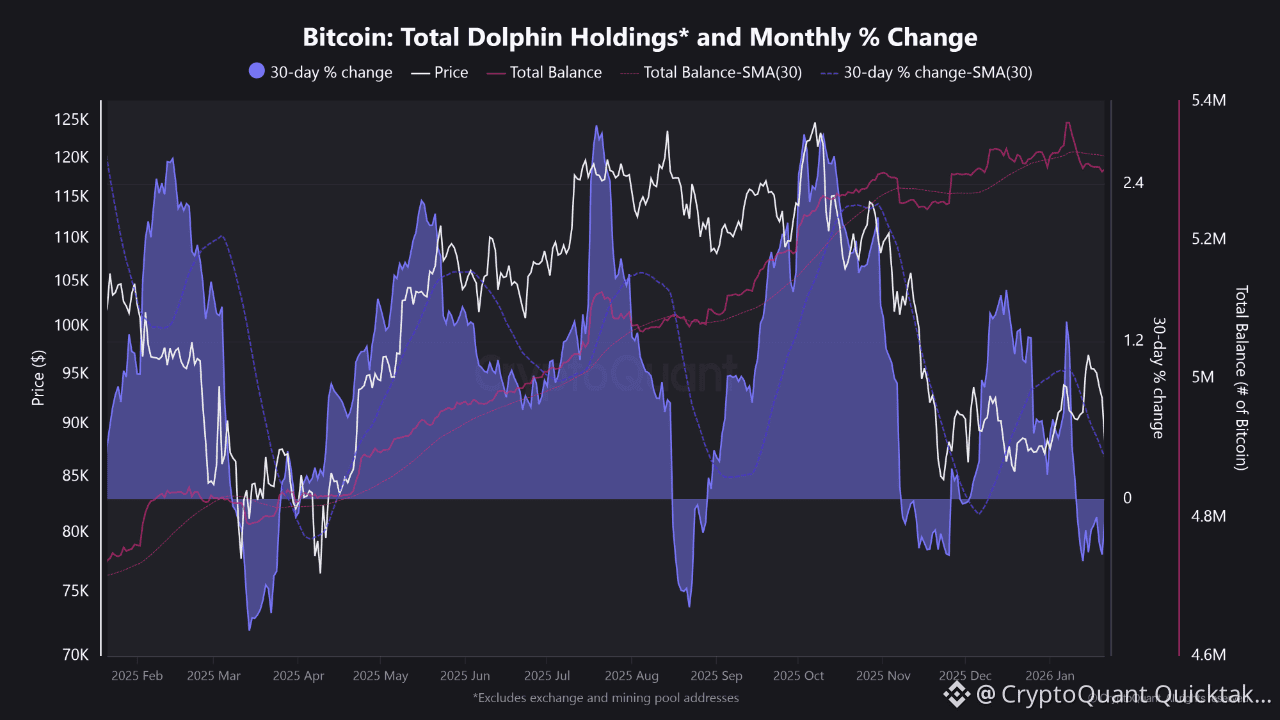
Thirdly, Dolphin Holdings (addresses holding 1K to 10K BTC) chart indicates that after a period of aggressive accumulation during the 2025 rally, the 30-day percentage change has dipped into negative territory. This indicates that these medium-to-large investors have shifted from "HODLING" to profit-taking.
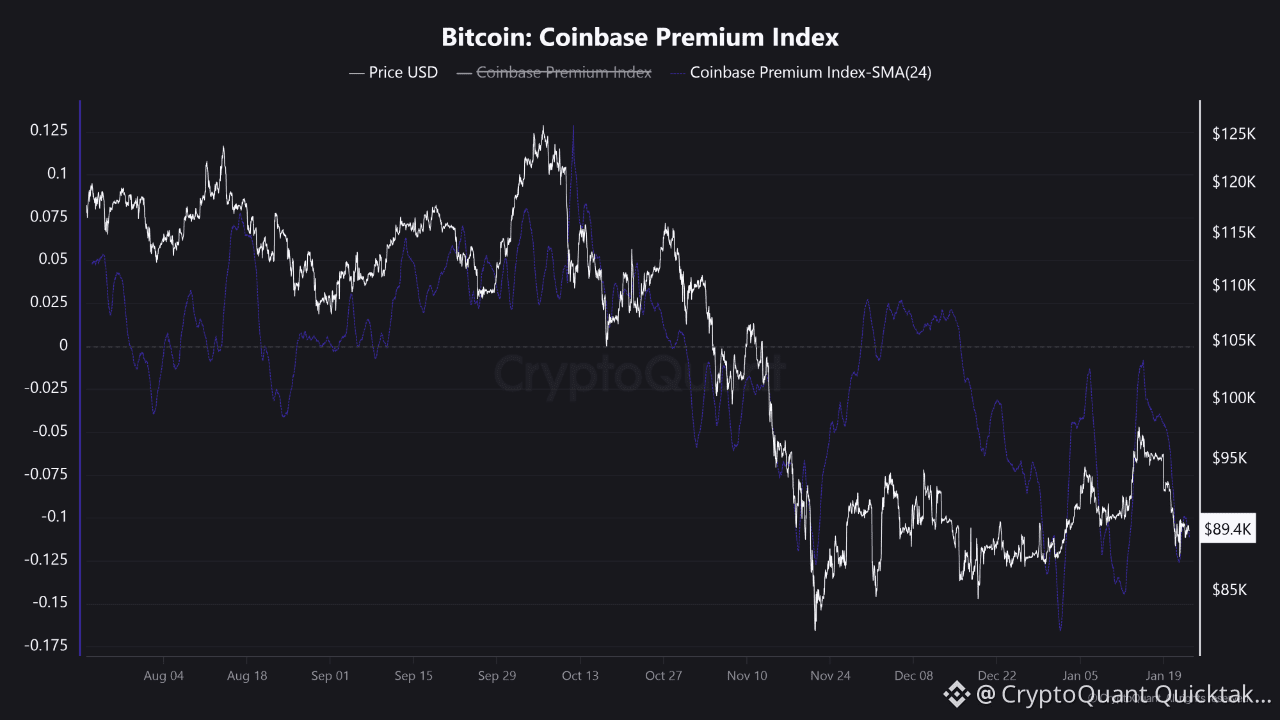
Finally, Coinbase Premium Index has been sitting in deep negative territory. This suggests that the current price drop toward $89.4K is being driven, in part, by US-based investors and institutions offloading positions or showing a lack of appetite at these levels compared to the global market.
In a nutshell, All four indicators are currently showing a bearish convergence. US institutional demand is weak, overall demand is negative, and both Dolphins and Whales are in a distribution (selling) phase.
Written by EgyHash