1. 📊 Stage Determination
Main Stage: After distribution enters the sell-off phase (O - Markdown) Specific Sub-stage/Event: Completed the 'Buying Climax' (BC) and 'Distribution Range', currently in a strong downward trend, recently experienced a collapse after the 'Last Point of Supply' (LPSY). Confidence Level: ★★★★☆ (Clear signals, definite trend)
2. 🔍 Key Findings and Logic
Volume and Price Analysis:
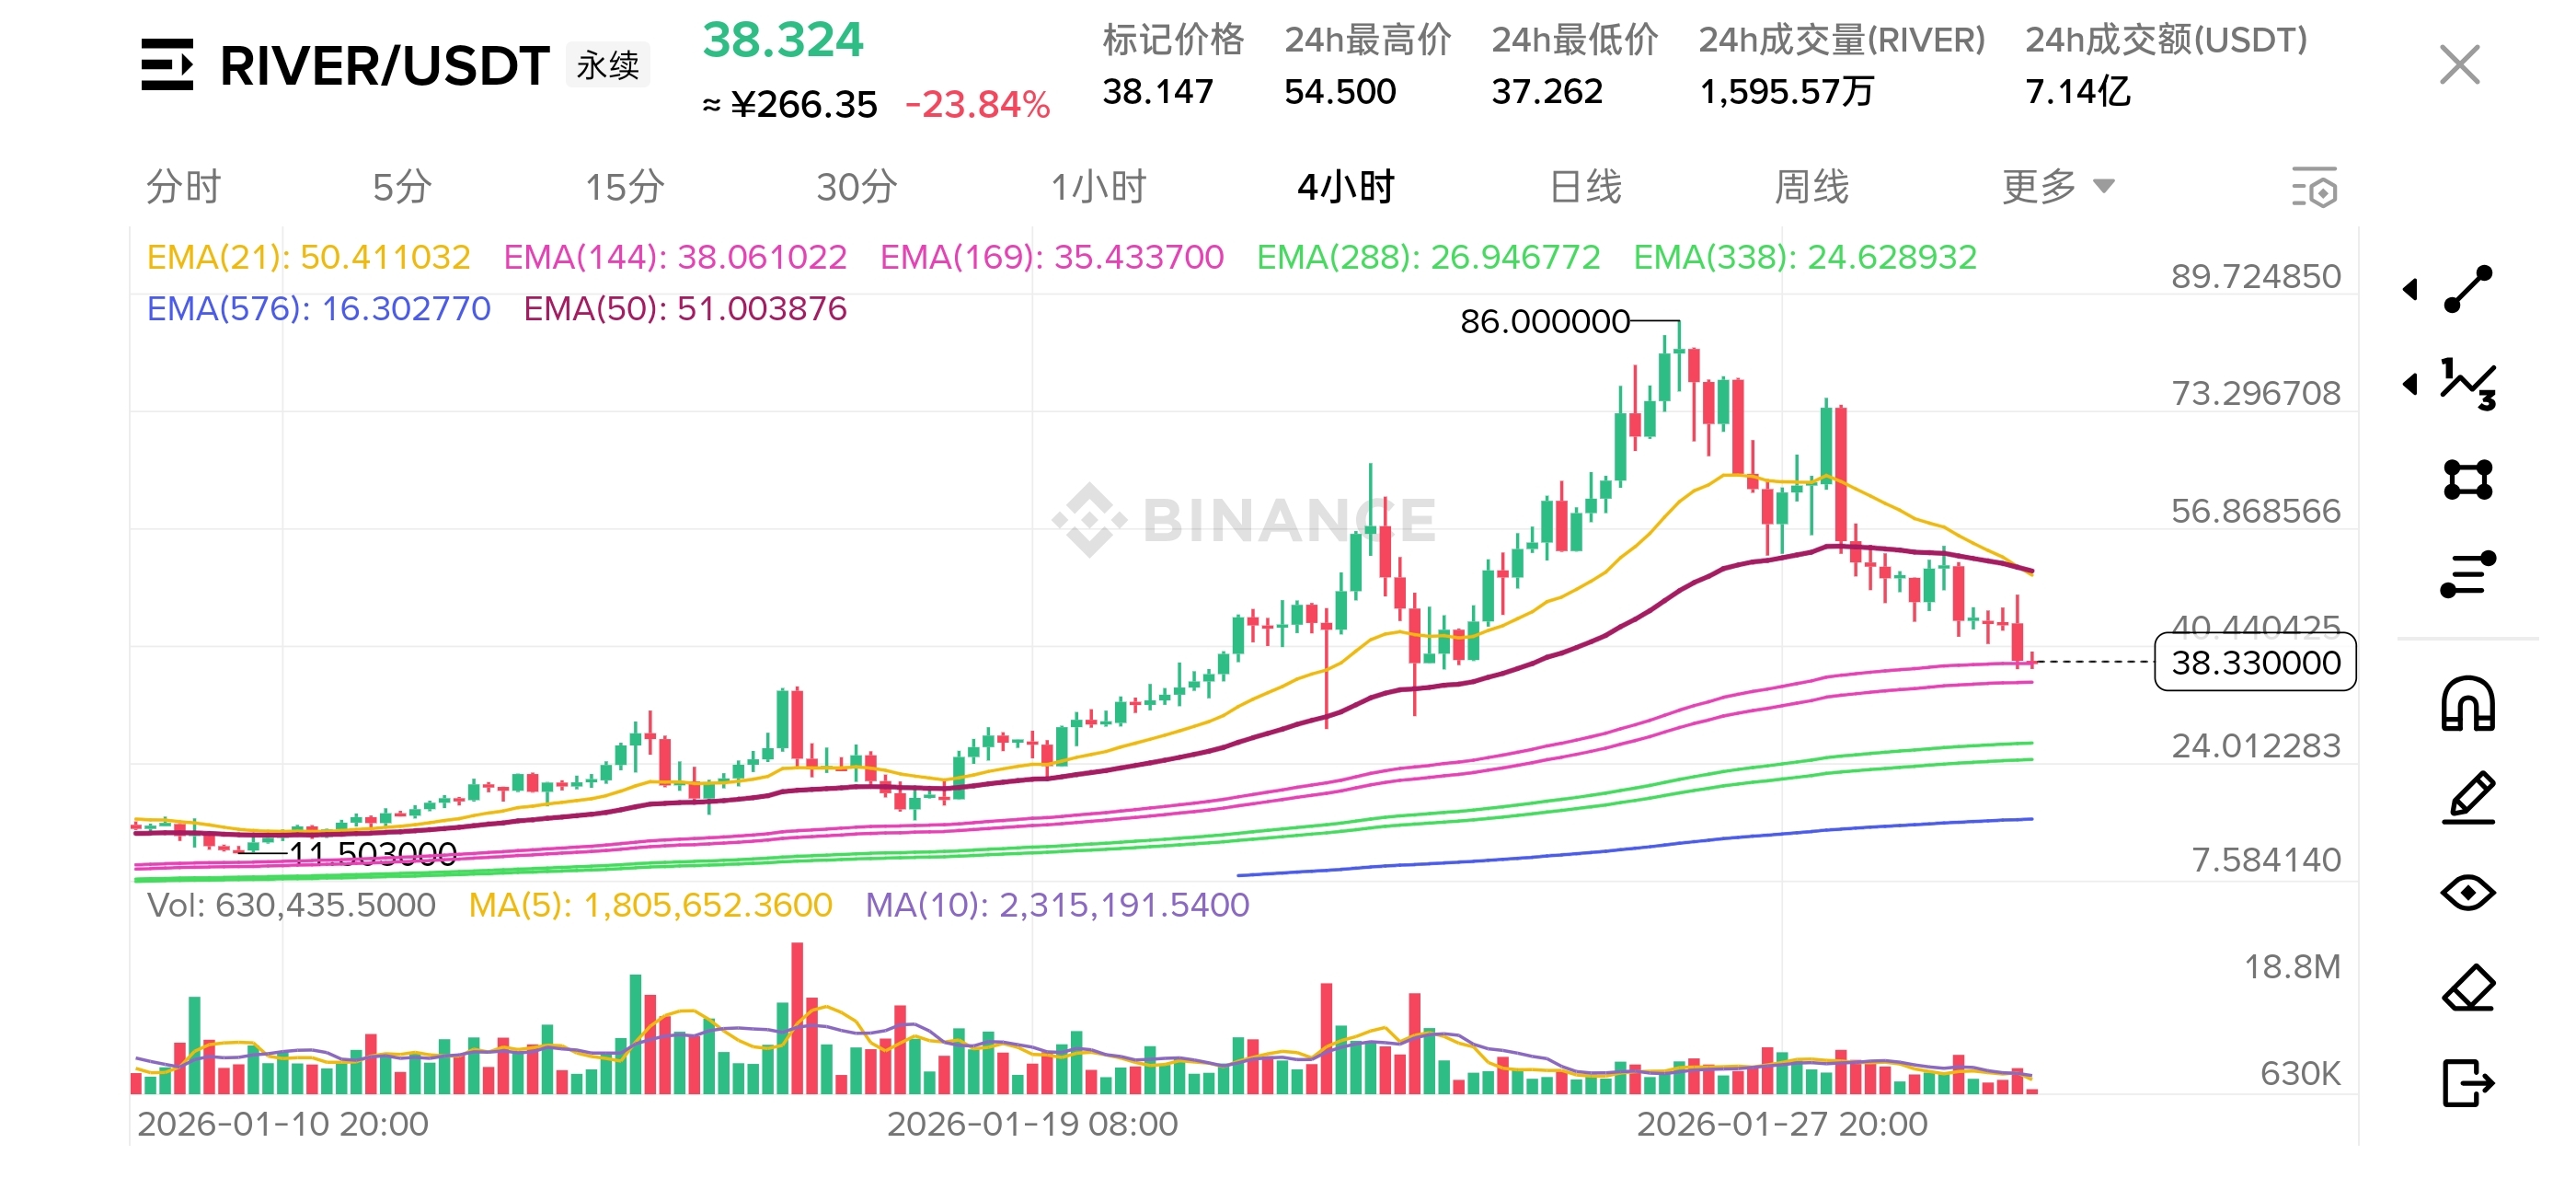
In the early part of the chart from the middle to the right side, the price forms a significant high-level oscillation range (Distribution Range). Near the top of the range, there is a long upper shadow or stagnation candlestick with high trading volume, which is a typical 'Buying Climax' (BC) signal, indicating that the operators are selling heavily at high prices while the public is actively buying.
End of Distribution Range: The price attempts to break upward but fails, forming an "Upthrust" pattern, with increased volume but the price unable to stabilize. This is a strong signal of renewed supply entering the market.
Crash Phase: The price breaks down through the lower support of the distribution range with increased volume, marking the confirmation of the "Last Point of Supply" (LPSY) and the formal initiation of a downward trend (Markdown). Recently, the price has accelerated downward with trading volume remaining at a high level (relative to the reduced volume in the later stage of distribution), indicating that selling pressure remains heavy.
Key Event Identification:
BC (Buying Climax): High volume stagnation at high levels or long upper shadows, public buying frenzy, and the operator takes the opportunity to distribute.
Upthrust (UT): A false upward breakout of the upper edge of the distribution range, attracting chasing buyers before quickly retreating, confirming supply dominance.
Distribution Range: The high-level consolidation area on the right side of the chart.
LPSY (Last Point of Supply): The price breaks down through the lower edge of the distribution range with increased volume, confirming the completion of distribution.
Crash: Accelerated decline after breaking support.
"Effort vs. Result" Assessment:
Distribution Late Stage/UT Phase: When the price breaks upward, trading volume increases (effort), but the result is a rapid price drop (result fails), a typical "effort without result," indicating that supply far exceeds demand.
Breaking Support Phase: High trading volume (effort) corresponds to a significant price drop (result is clear), with severe supply-demand imbalances, and supply completely controls the market.
Current Decline: The price continues to make new lows, with each rebound accompanied by shrinking trading volume (weak demand), while trading volume increases during declines (sustained supply), consistent with "effort vs. result," confirming that the downward trend is healthy and strong.
3. 🗺️ Market Structure Analysis
Support Level:
1. Major Support: The starting area of the previous upward wave on the left side of the chart (around 11.50, a historically dense trading area).
Resistance Level/Supply Zone:
1. Major Resistance/Supply Zone: The lower edge of the original distribution range (approximately the 56.86 - 60.00 area). This area is where a large amount of stock was released, and many trapped positions will pose strong resistance to rebounds.
2. Recent Resistance: The rebound high points during the decline (such as the most recent rebound high, around 44.40).
Trend Structure:
Clear Downward Trend: A series of lower highs (LH) and lower lows (LL). The EMA system shows a bearish arrangement (short-term EMA runs below long-term EMA and the slope is downward). Each rebound failed to break through previous highs and was quickly suppressed back down by greater selling pressure.
4. 🎯 Trading Scenario Simulation
Bearish Scenario (Entry Conditions):
Short Selling on Rebound: When the price rebounds to recent resistance levels (such as around 44.40 or EMA21) and shows signals of being blocked (such as shrinking volume on the rise, long upper shadows, bearish engulfing), consider short selling in the direction of the trend.
Breakdown Short Selling: The price breaks down through the lower edge of the current trading range (if a small platform forms before the breakdown) or recent lows (around 37.26), short selling can be pursued.
Target Level: According to the "Law of Cause and Effect," the thickness of the distribution range (e.g., from the lower edge to the BC high) can roughly estimate the downward target. A portion of the decline has already been realized, and the next target can be looked at historical support levels (around 11.50).
Failure Conditions:
Conditions for Bearish Analysis Failure: The price strongly breaks through the lower edge of the original distribution range with increased volume (main resistance area above 56.86) and stabilizes above this area. This would declare the distribution a failure and may re-enter an upward trend. Currently, the probability of this situation is extremely low.
5. ⚠️ Risk Warning
"This analysis is based on the Wyckoff method and is only a probabilistic speculation, not investment advice."
"The market always has uncertainty; please manage your positions and risks carefully."
Current Core Risk: A technical rebound may occur in a downward trend, but do not speculate on the bottom or bottom-fishing too early before clear accumulation signals and bottom structures appear. The strength of the bearish trend is often stronger than expected.#威科夫供需量价