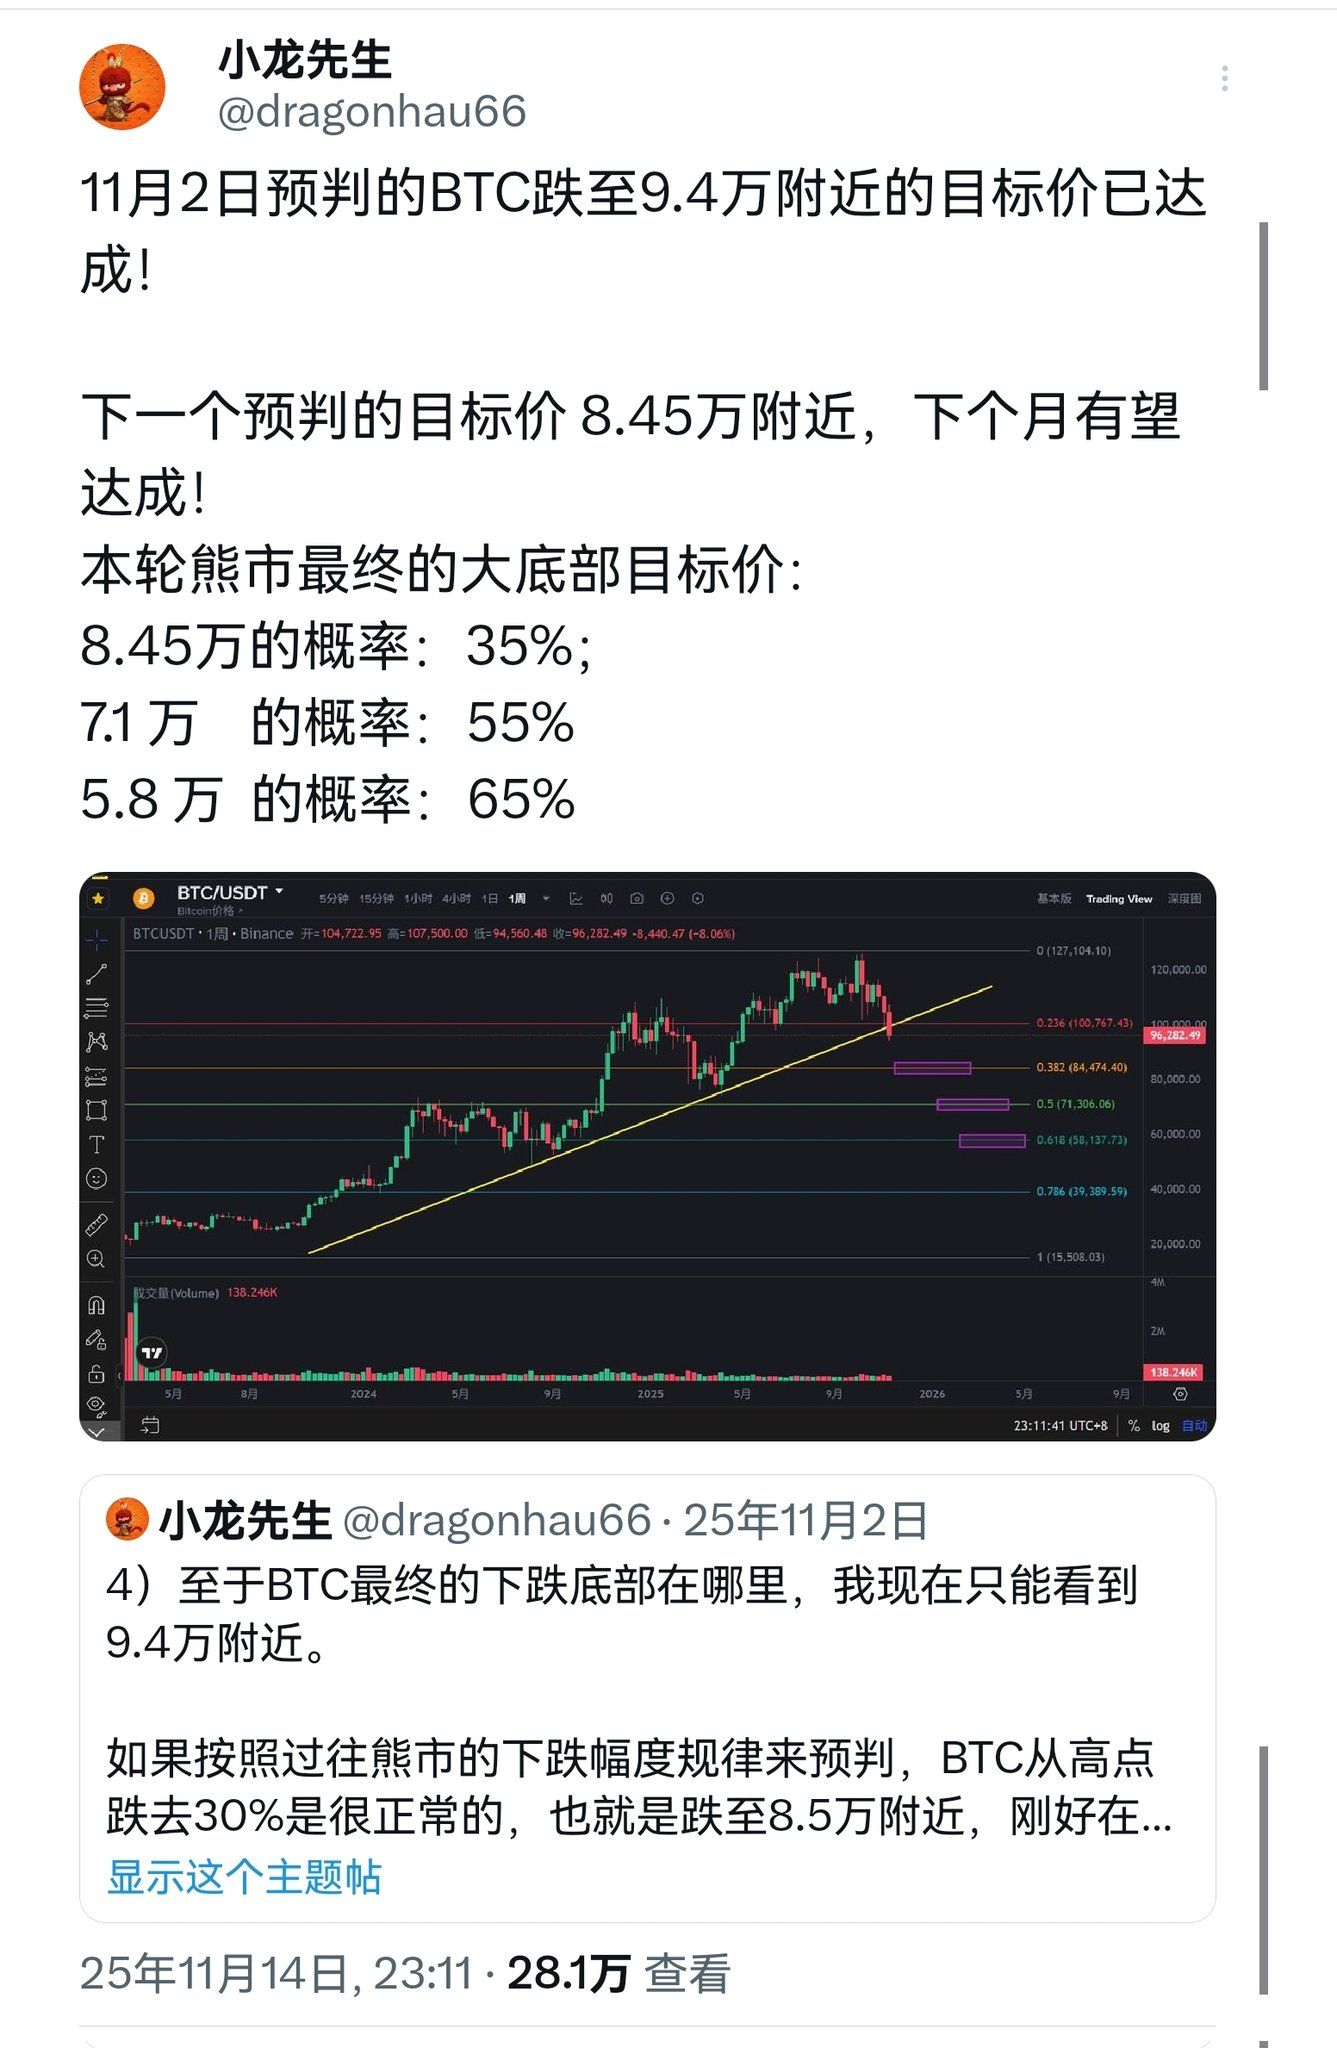
I tweeted on November 14, 2025, predicting the medium-term downward trend of BTC, analyzing the key price points for BTC's decline. For details, please see the prediction chart below, which is still very effective. This tweet received 280,000 likes.
Next, I want to take root and sprout in Binance Square, lighting a lamp of hope. I hope that through my professional analysis and predictions of BTC's market trends, I can help more friends understand the market in advance and seize trading opportunities for BTC trends, allowing everyone to make money. This is my original intention and wish.
We need to understand a financial market rule: the direction of the medium to long-term trend is determined by fund flow and the strength of volume, not by candlestick patterns and structural shapes. Only by understanding the data on the chain and fund flow, as well as analyzing the changes in the strength of long and short positions, can we more accurately predict the direction of the medium to long-term trend.
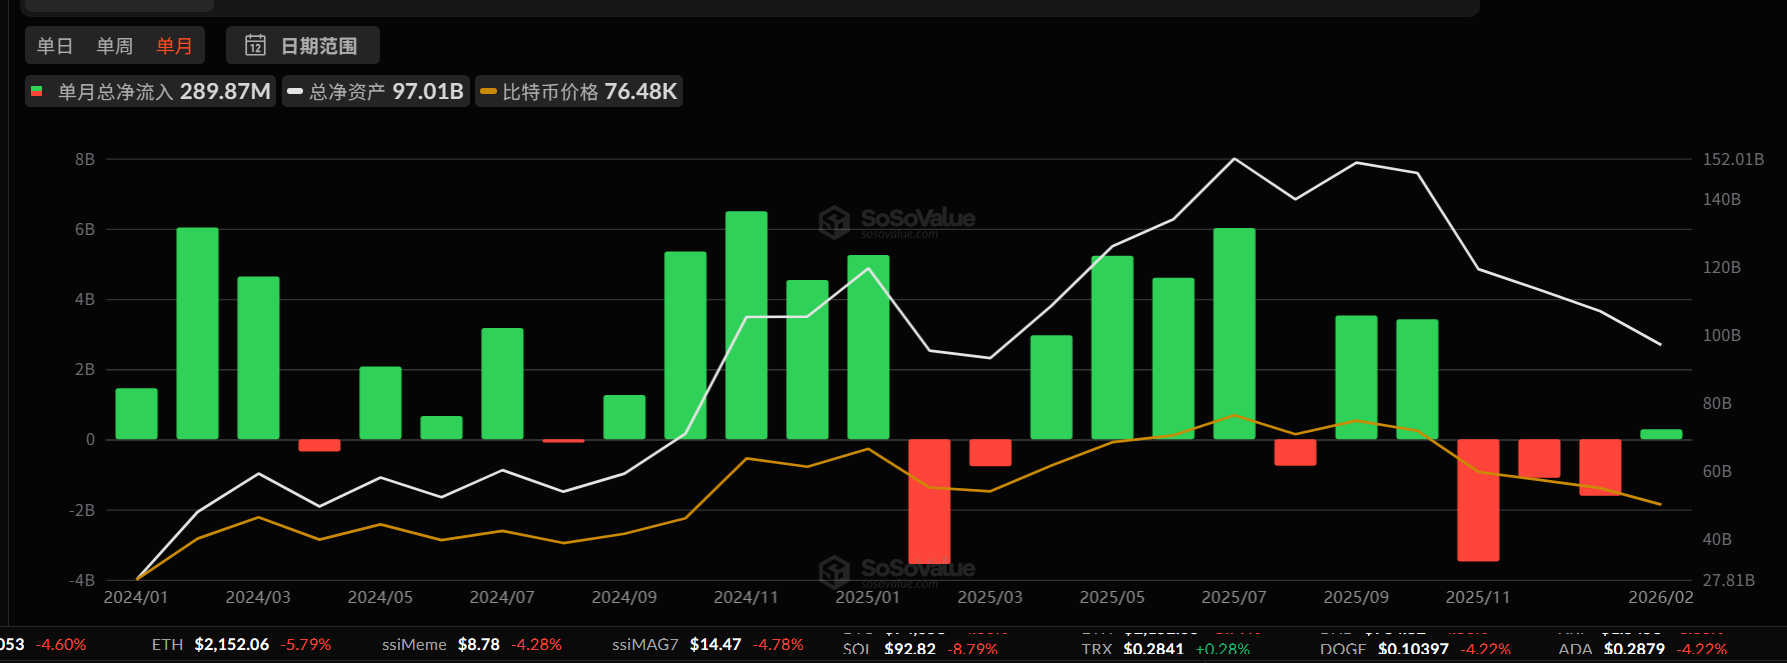
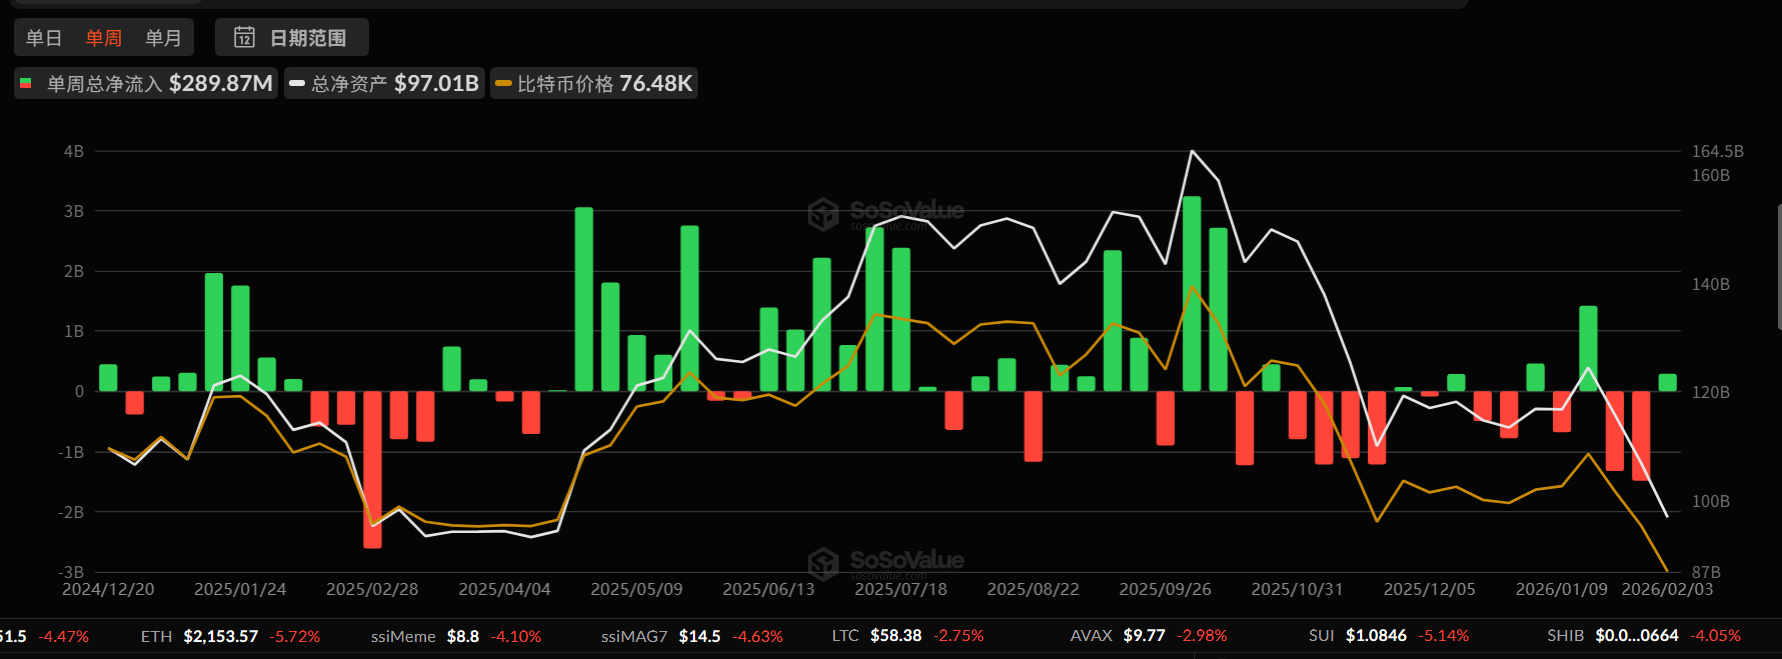
First, let's take a look at the fund flows of BTC spot ETF institutions. In the past three months, the total net outflow from ETF institutions was: 3.45B, 1.09B, 1.61B USD, and the total net outflows for the last two consecutive weeks were: 1.33B, 1.49B. This week is not yet over, but from the recent days' fund flows, it seems that this week’s ETF funds are also likely in a net outflow state. It is evident that spot ETF institutions have been continuously selling BTC over the past three months and currently. The bear market has entered a middle stage, but the bottom has not been seen.
Next, let’s look at the strength changes of long and short positions at the four-hour level over the past four months. The waterfall drop on October 11, 2025, saw a significant short volume, establishing BTC's intermediate downtrend direction, followed by BTC's continuous oscillating drop above 80,000; on November 21, 2025, a significant long volume appeared, leading to a rebound from 80,000 to 98,000; however, on February 1 and February 4 of this year, two significant short volumes appeared, indicating that there was considerable short selling at 80,000 and 76,000, with shorts in absolute strength and longs showing weakness. The likelihood of 75,000 being the bottom of the bear market is low, and BTC will continue to oscillate downward.
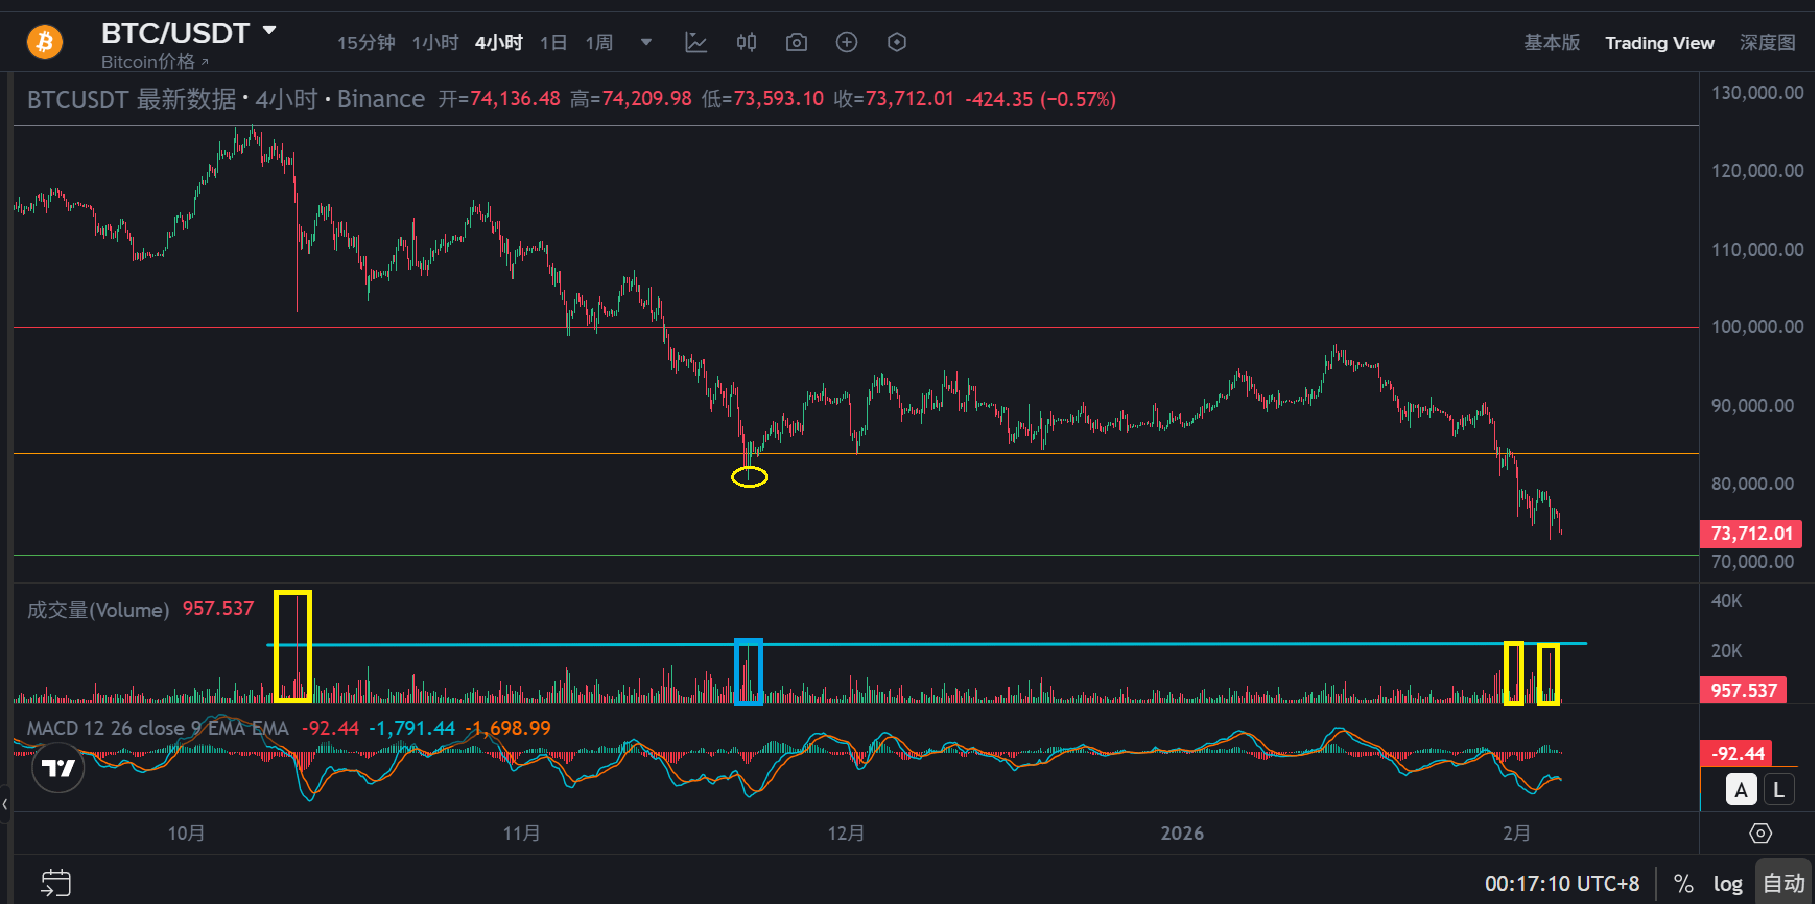
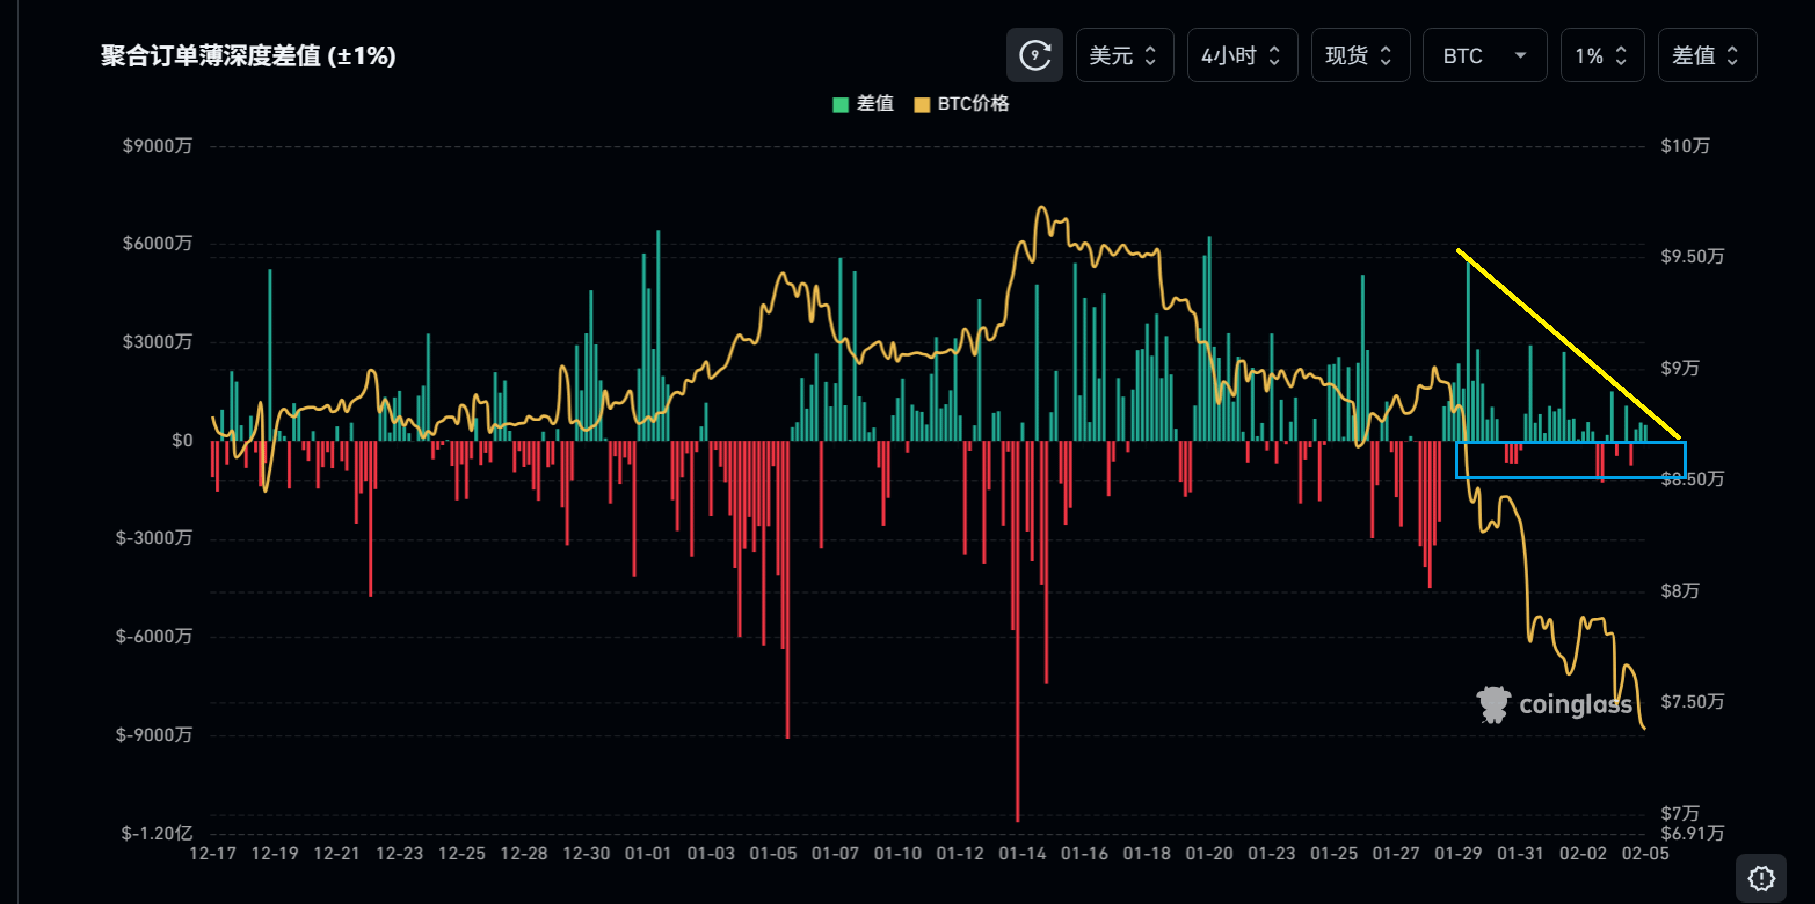
Furthermore, let's look at the data situation of commission buy and sell amounts from BTC's order book. Since BTC completely broke below the important support price of 80,000, as the price continuously dropped, the commission buy amounts on the order book have also been continuously decreasing and shrinking, indicating that the buying power is getting weaker. The public and institutions have become firmly convinced that BTC has entered a bear market, so BTC is likely to continue to oscillate downward in the coming months.
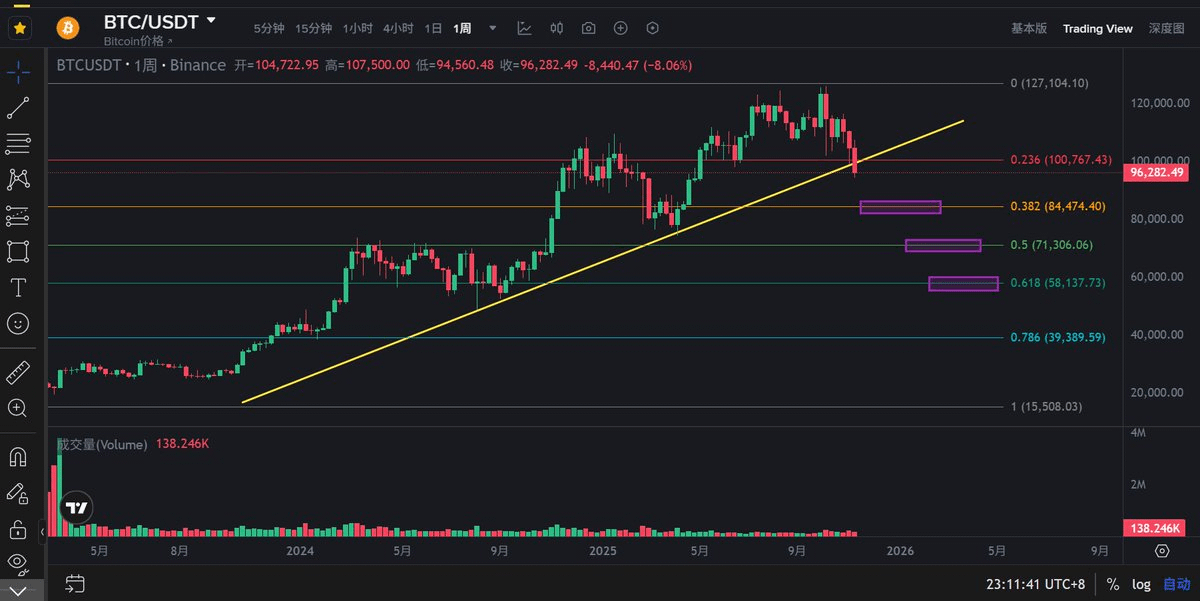
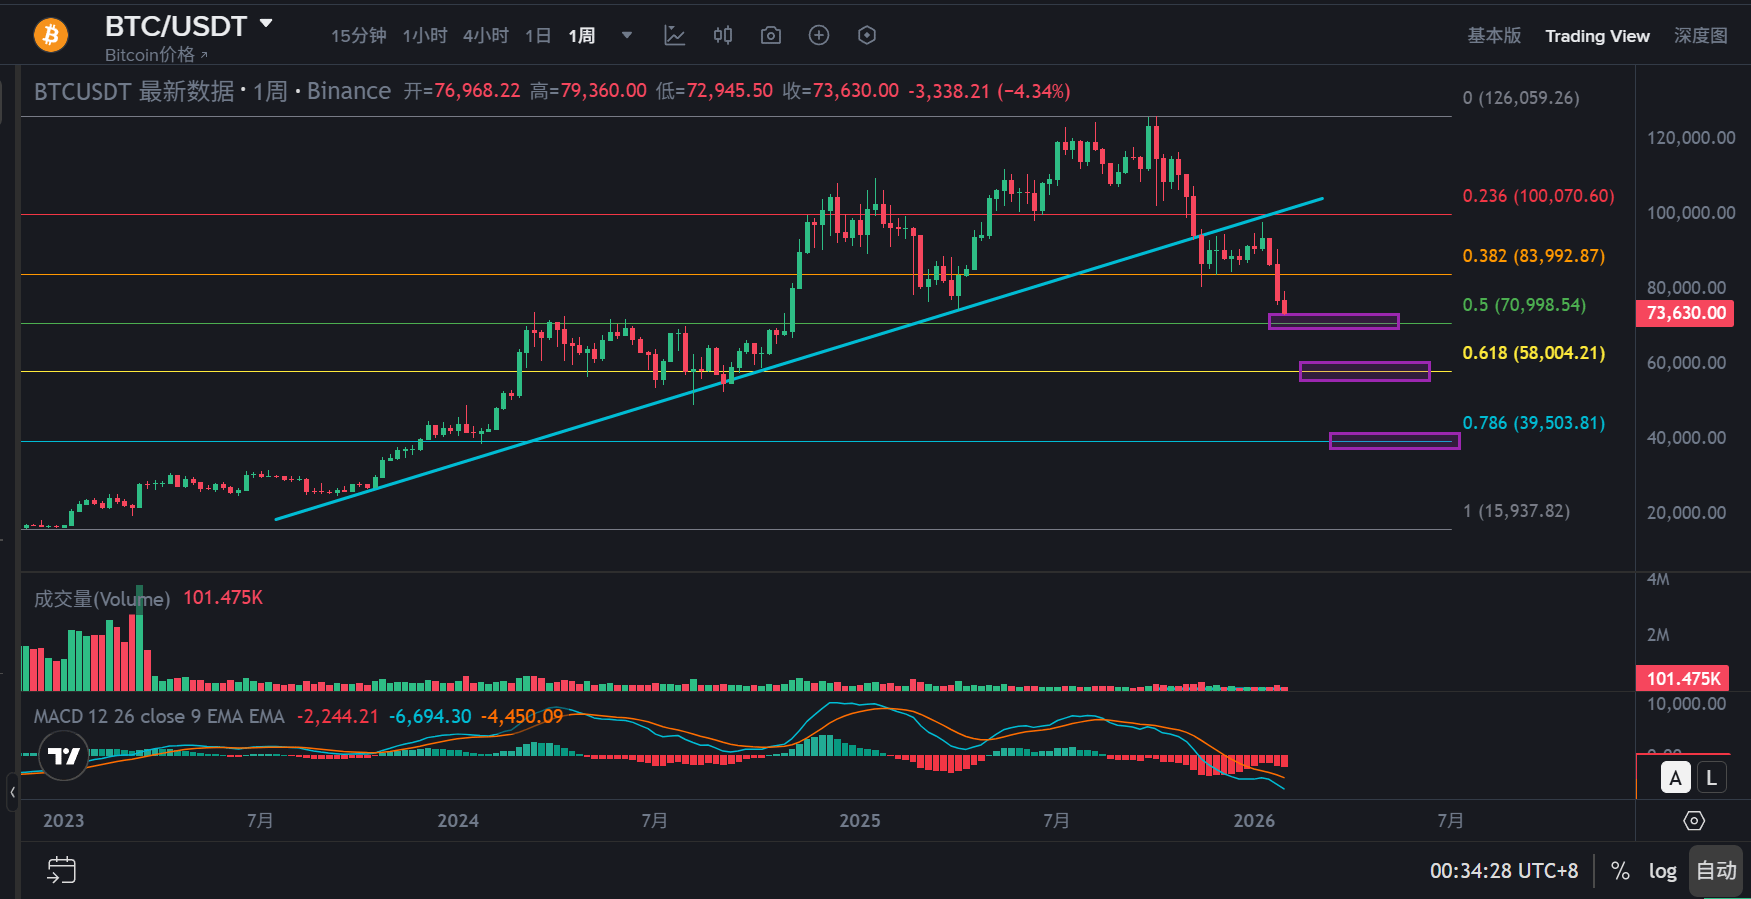
Look at the space from the monthly line and the trend from the weekly line. From BTC's weekly trend, the price has long since broken below the weekly rising trend line, and the intermediate downtrend is already unquestionable.
Finally, let's predict where the market's significant bottom will be in the next six months based on BTC's weekly candlestick chart. According to the Fibonacci retracement from the high price of 127,000 to the historical low of 15,600, the 0.5 position is a weak gravitational position, indicating that around 70,000 is probably not the market's bottom price; the 0.618 position is a strong gravitational position that will pull the price down to around 58,000, which is a dense transaction area and a strong support price. The true significant bottom of the market may be born around 58,000, and in extreme cases, it could fall to the 0.786 position, around 40,000. Currently, I cannot provide an accurate market bottom of either 58,000 or 40,000; we need to wait until BTC drops to 58,000 and then analyze the flow of funds from ETF institutions, the strength of long and short positions, and the order book's commission buy amounts to make a prediction.
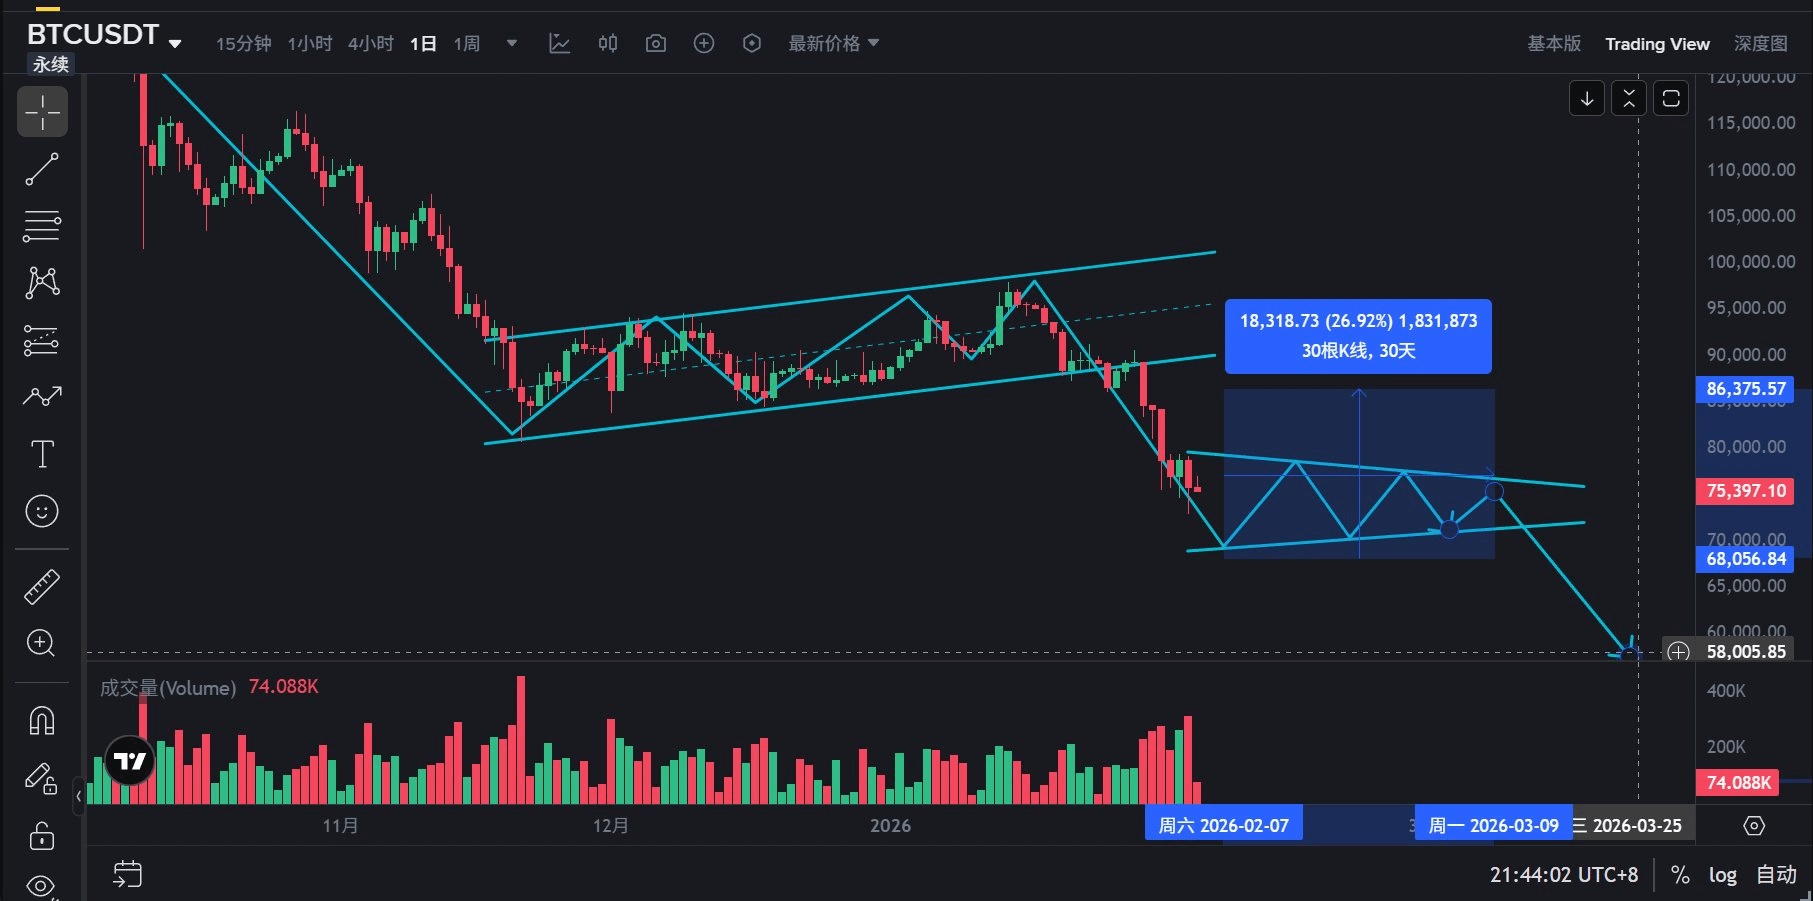
So, what will the BTC price trend look like in the next three to four months? BTC's price will not drop straight to 58,000 but will exhibit a fluctuating downward trend to complete the bottom exploration. Below, based on my understanding of the market, I have projected the price chart for BTC's drop to around 58,000 in the next three to four months:
1) BTC's recent downtrend breaking below 80,000 will first drop to around 70,000, followed by a rebound of about 10,000 points.
2) The rebound from 70,000 to 80,000 could form a triangular continuation structure, oscillating for about 30 days, after which the price will break down again to around 58,000.
3) The price oscillating around 58,000 for a while raises the question of whether it is forming a significant market bottom or continuing to drop to 40,000, which is uncertain.
I am Mr. Long, a practitioner of natural trading theory and a Bitcoin market analyst. I have established a three-dimensional trading system of natural trading theory + on-chain data + volume-price relationship. One of my dreams is to be a professional market analyst and trader, helping more friends accurately grasp the market and make money.
The above BTC market analysis is not investment advice and is for reference only. If you find this article good, please follow me and share this article. Grateful for the encounter, thank you for your reading!