Bitcoin and Ethereum are trading in what looks like a correction and reaccumulation phase rather than a clear market top or a deep bear market bottom. Bitcoin is down about one third from its October 2025 all time high of $126,100 after a correction of roughly 36%, but it is still up around four to five times from the 2022 low near $16,000.
2025 ended slightly negative for Bitcoin, which was unusual for a post halving year. This supports the idea that the old four year halving cycle is no longer the main driver of price. Onchain valuation shows Bitcoin trading above its realized price, meaning the average holder is still in profit. This kind of environment is usually linked with consolidation or late cycle pullbacks rather than with major bottoms.
Network activity and fees are both low compared to the past two years. Addresses are still active, but transaction fees in both $BTC and USD are near multi year lows.
Long term holders have slowed their profit taking and only small pockets of capitulation have appeared. Mid sized whales have been selling, while very large holders and corporate treasuries have been more stable.
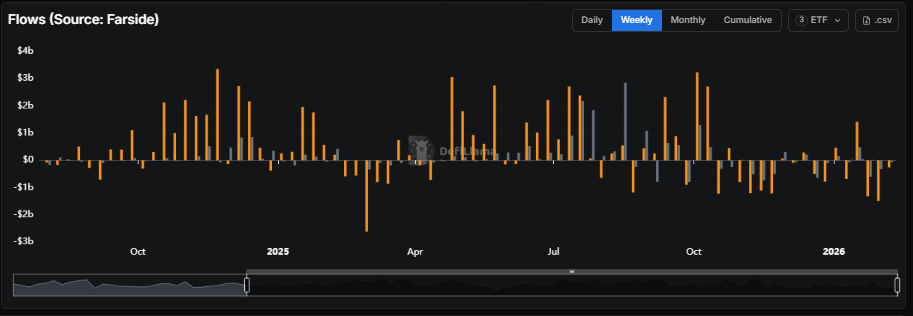
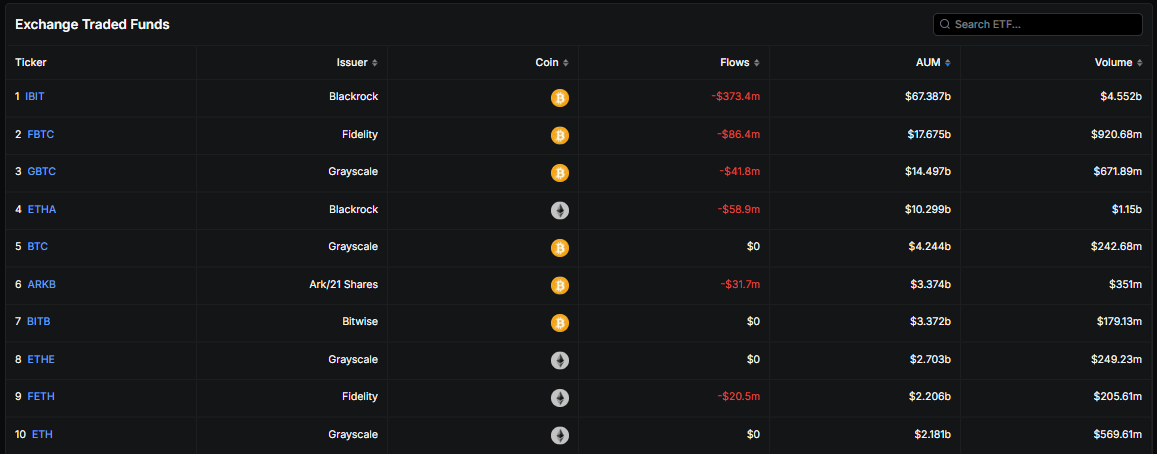
ETF flows were strongly negative from late 2025 into January 2026, with more than six billion dollars leaving Bitcoin spot ETFs. In early February, there was one very large single day inflow, which may be an early sign that selling pressure is easing.
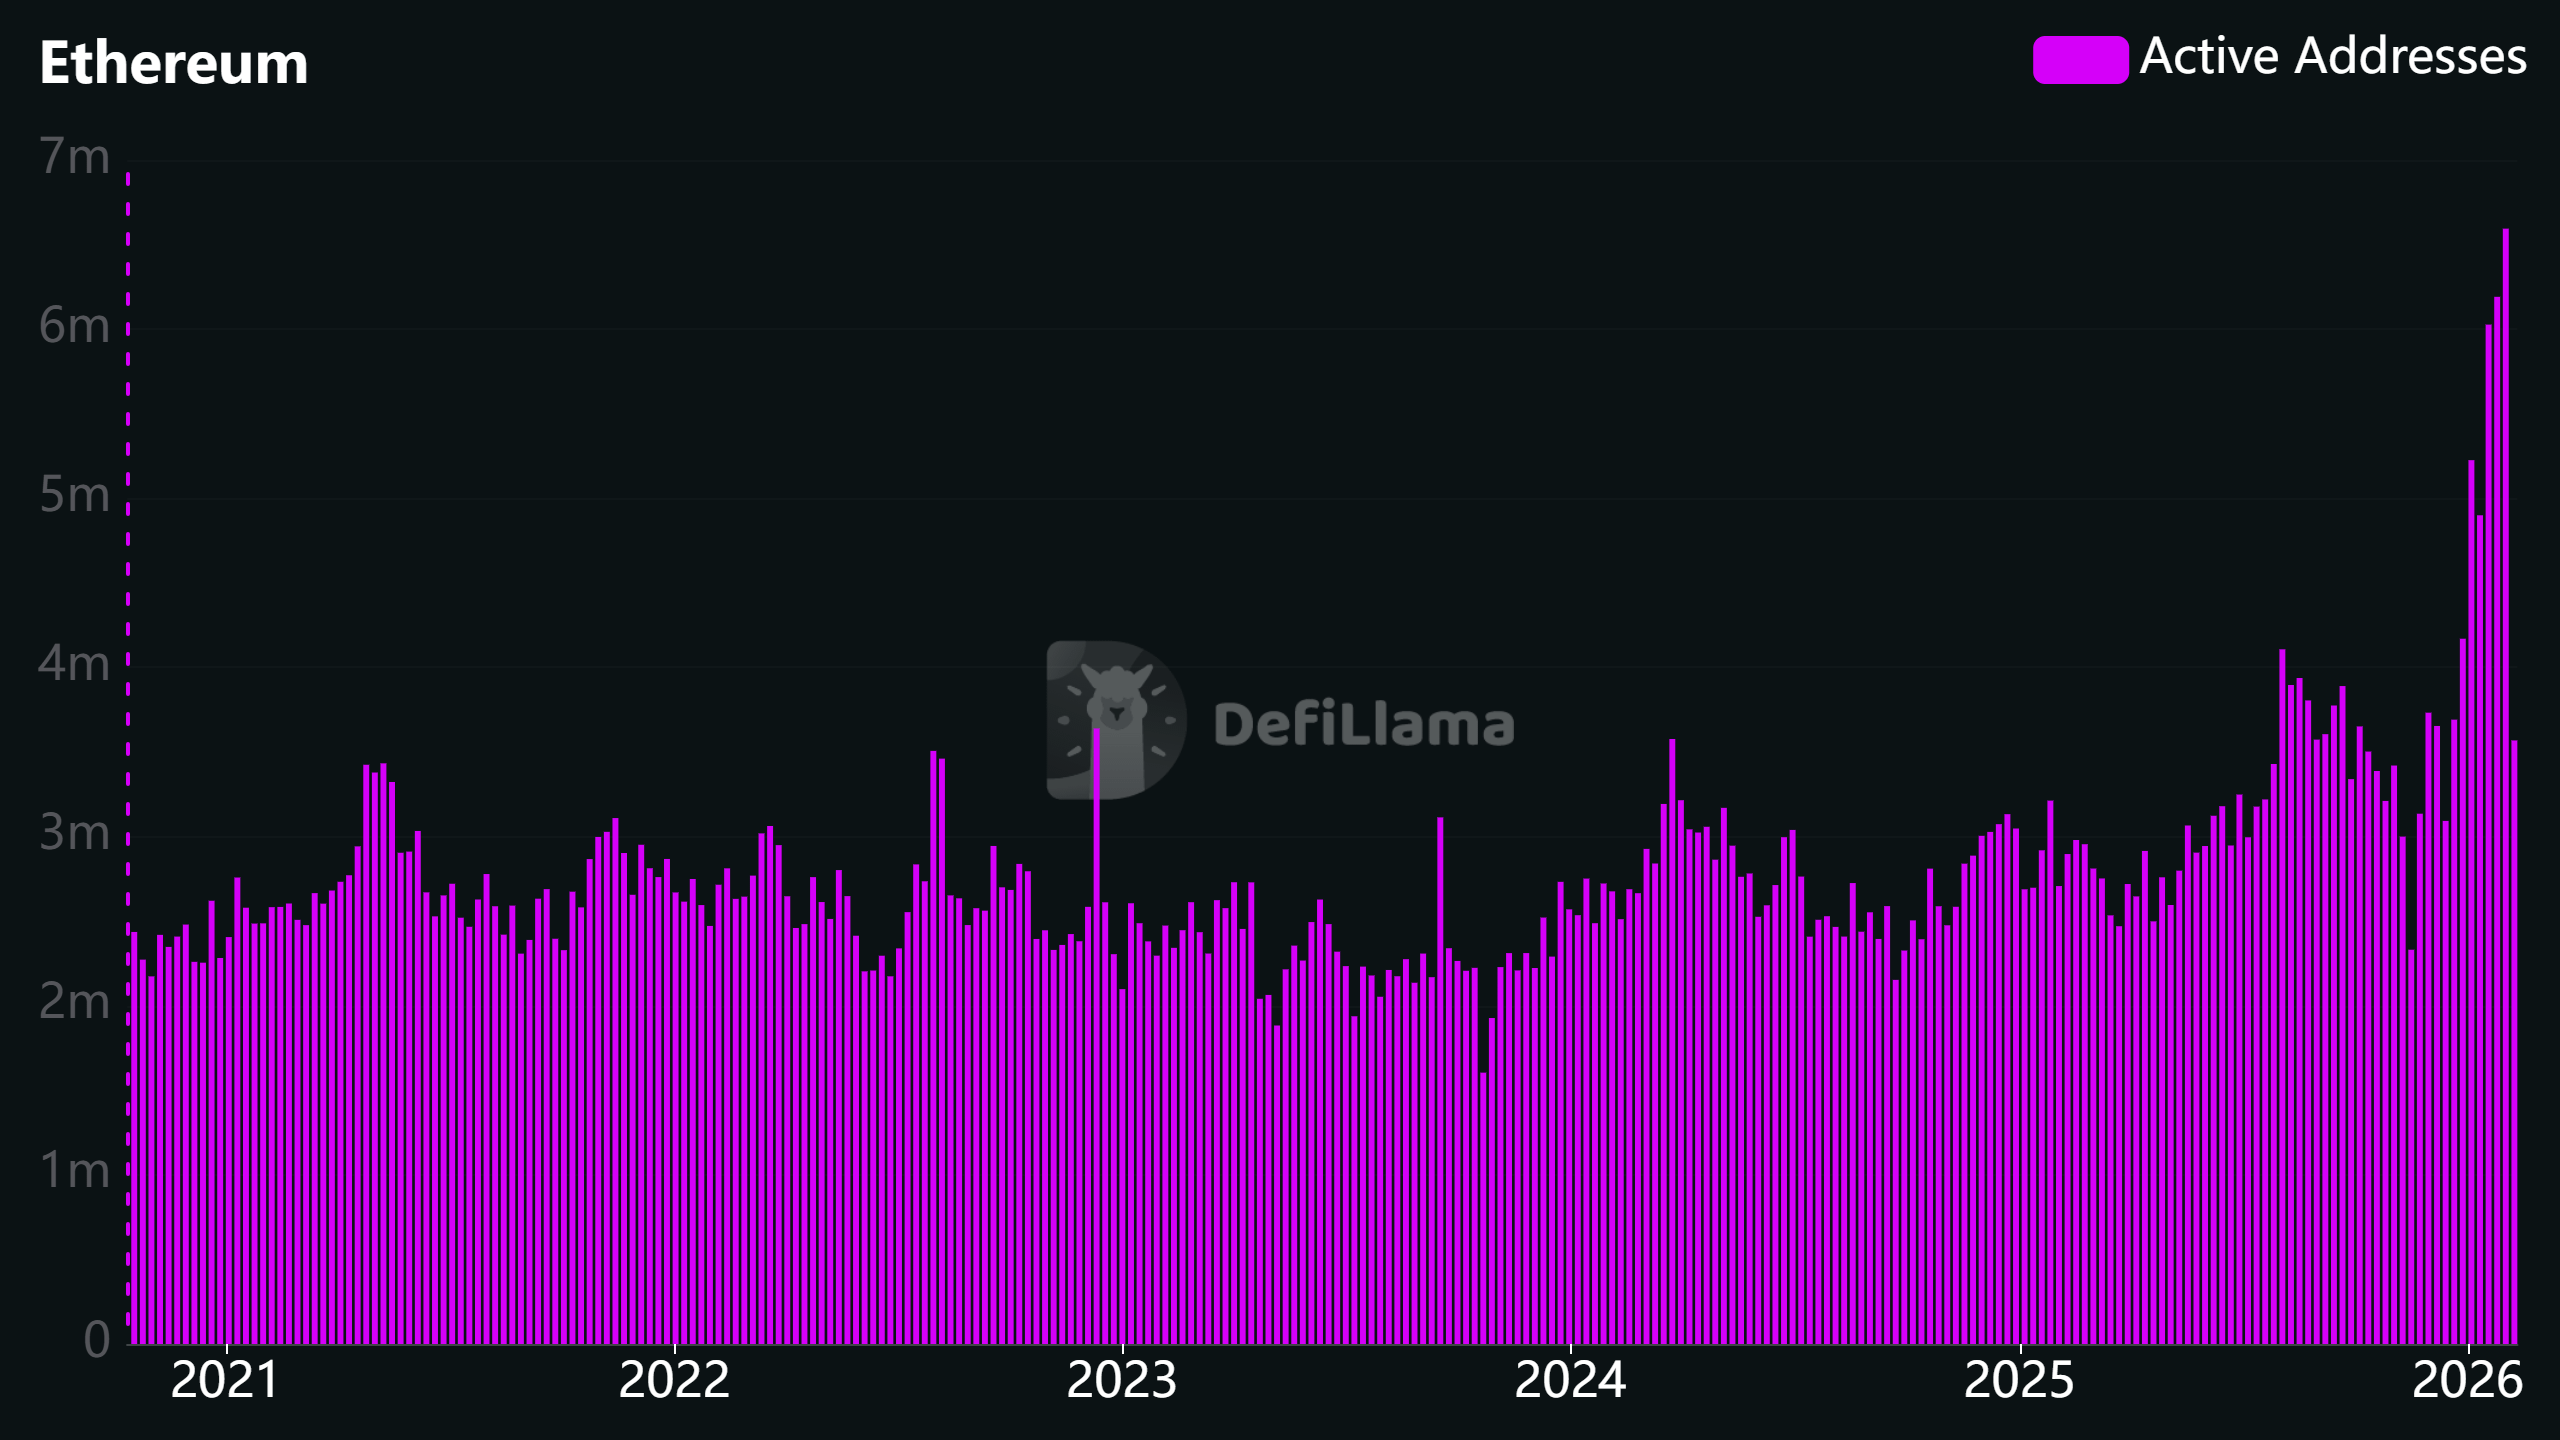
For Ethereum, usage is high but cheap. Daily active addresses and transactions are close to two year highs, while fees are much lower than average. This is mainly due to network upgrades and the migration of activity to layer two networks.
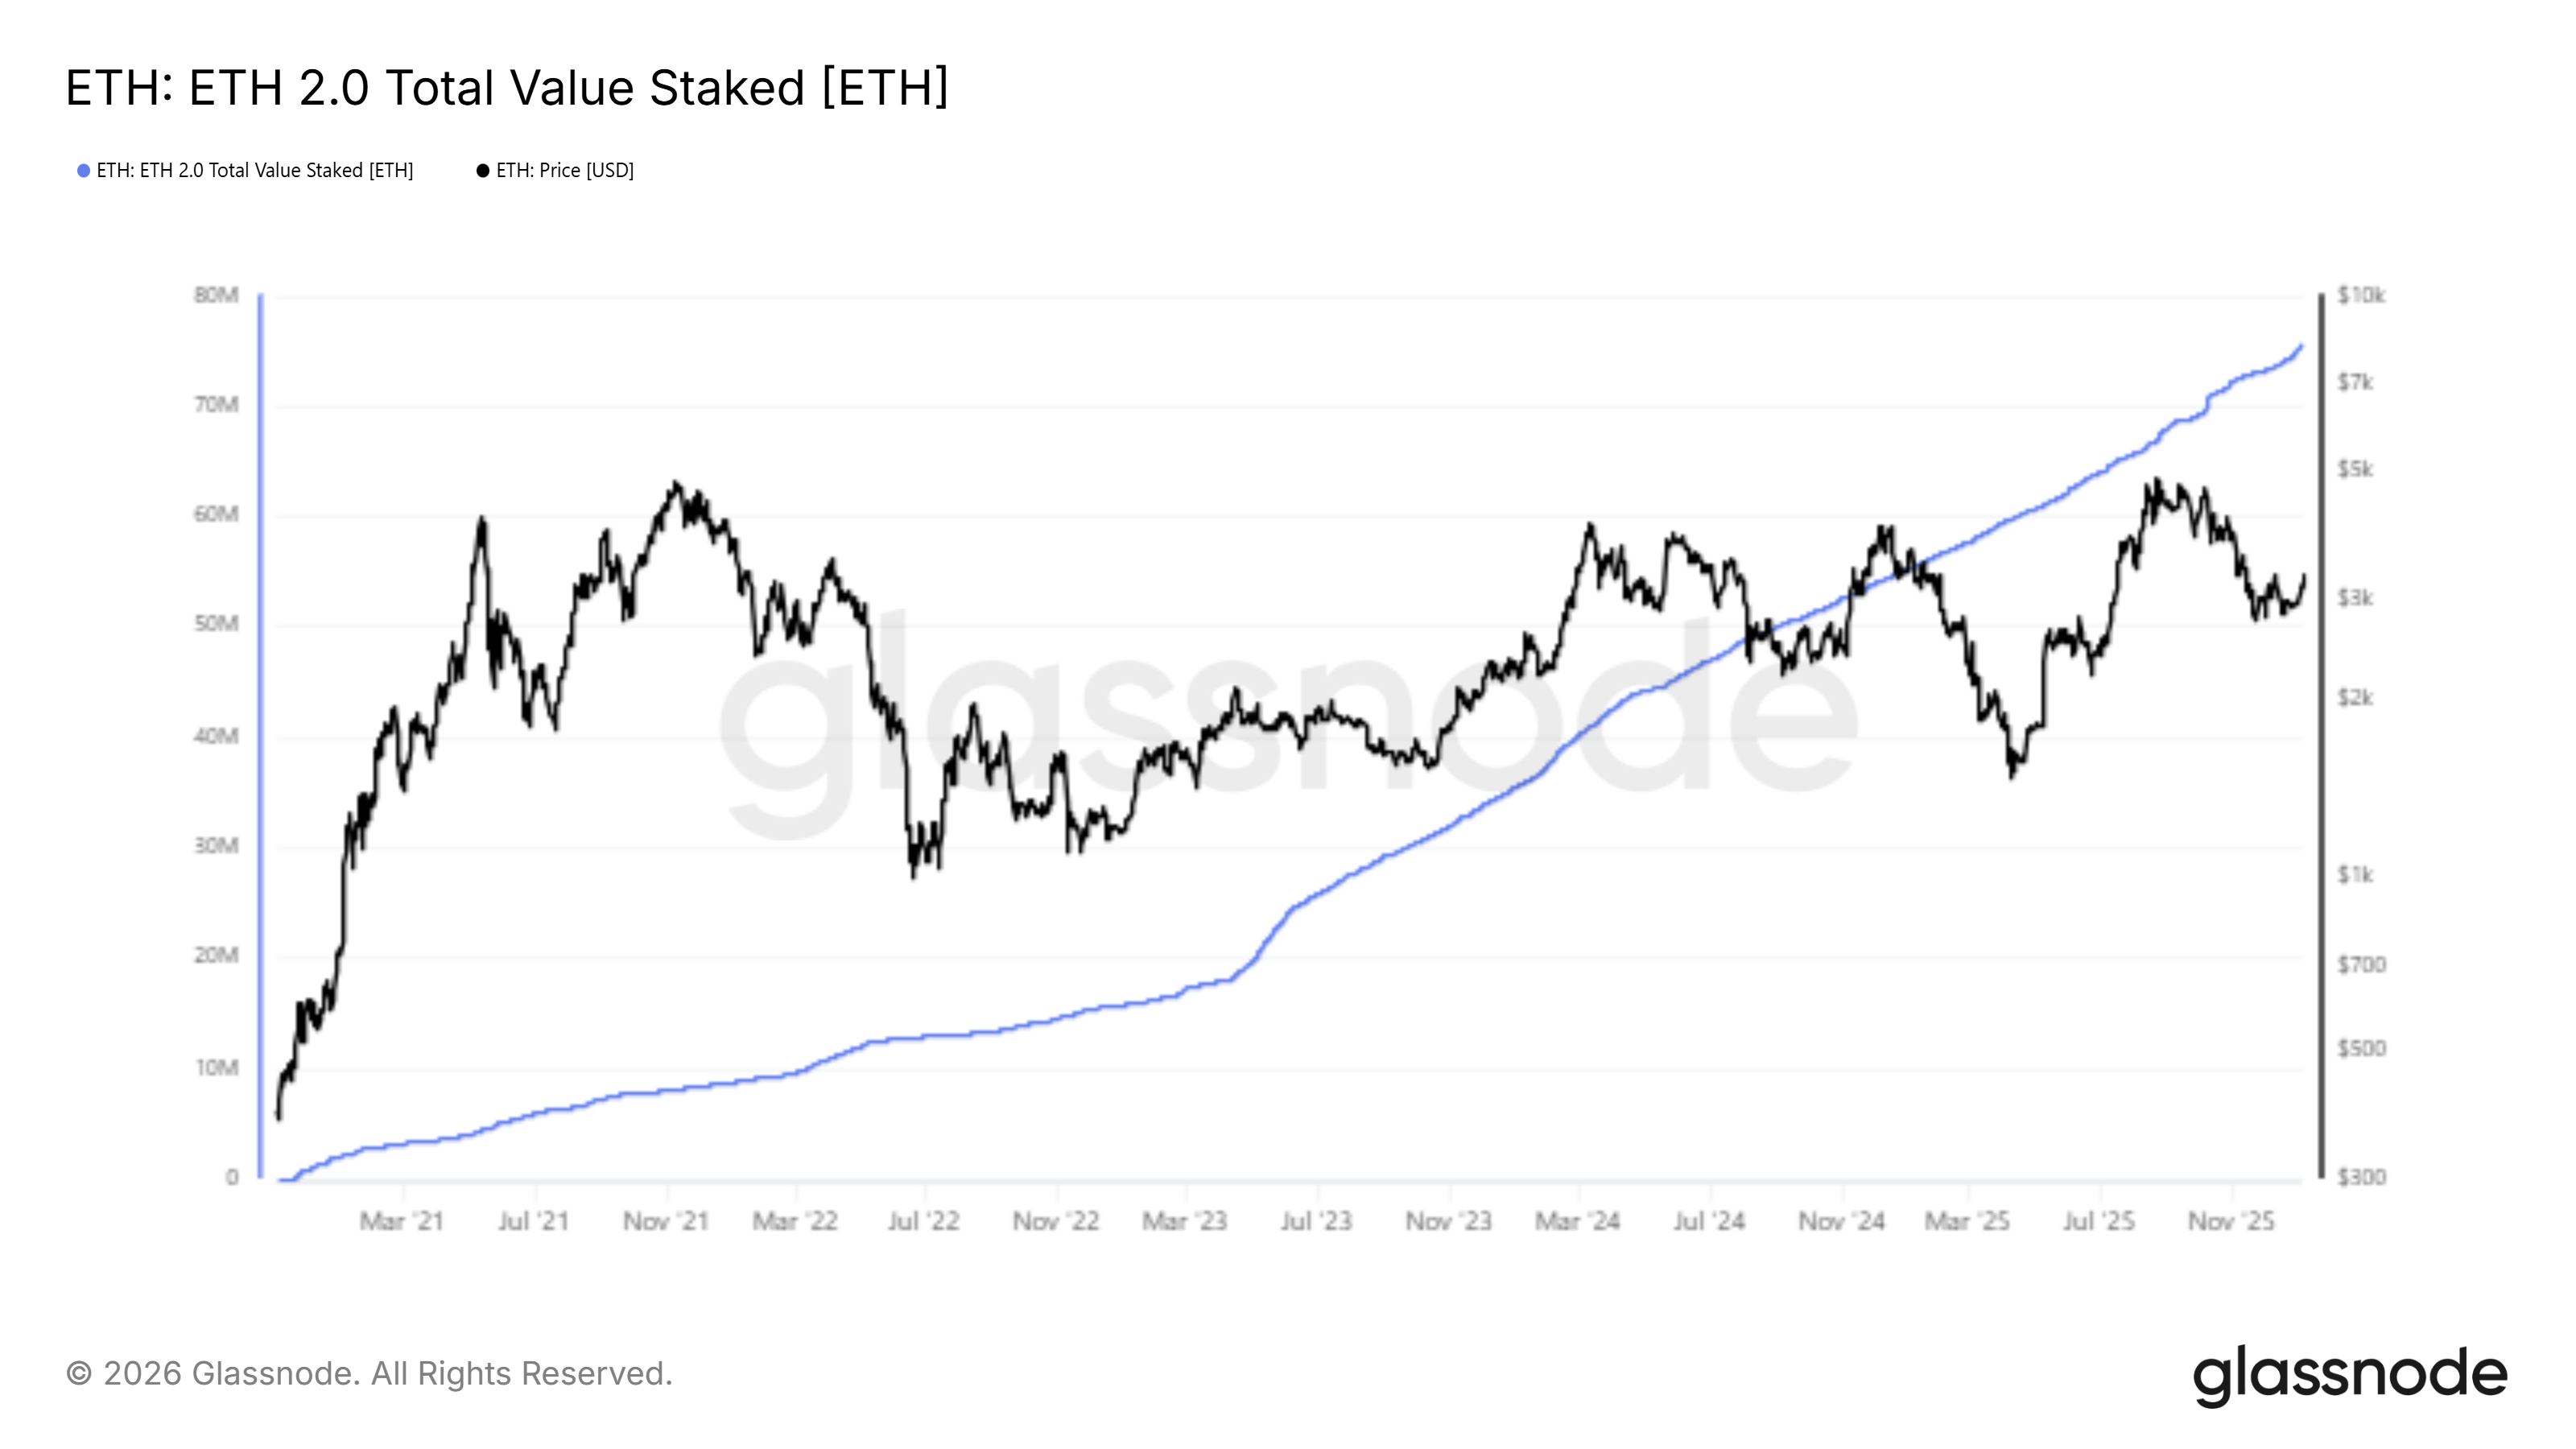
Almost half of all $ETH is now staked, and another large share sits in institutional funds and corporate treasuries. This locks up a big part of supply and reduces what is freely traded.
Layer two networks such as Base and Arbitrum are growing fast and driving most of the activity, even though they pay relatively little to Ethereum mainnet in fees.
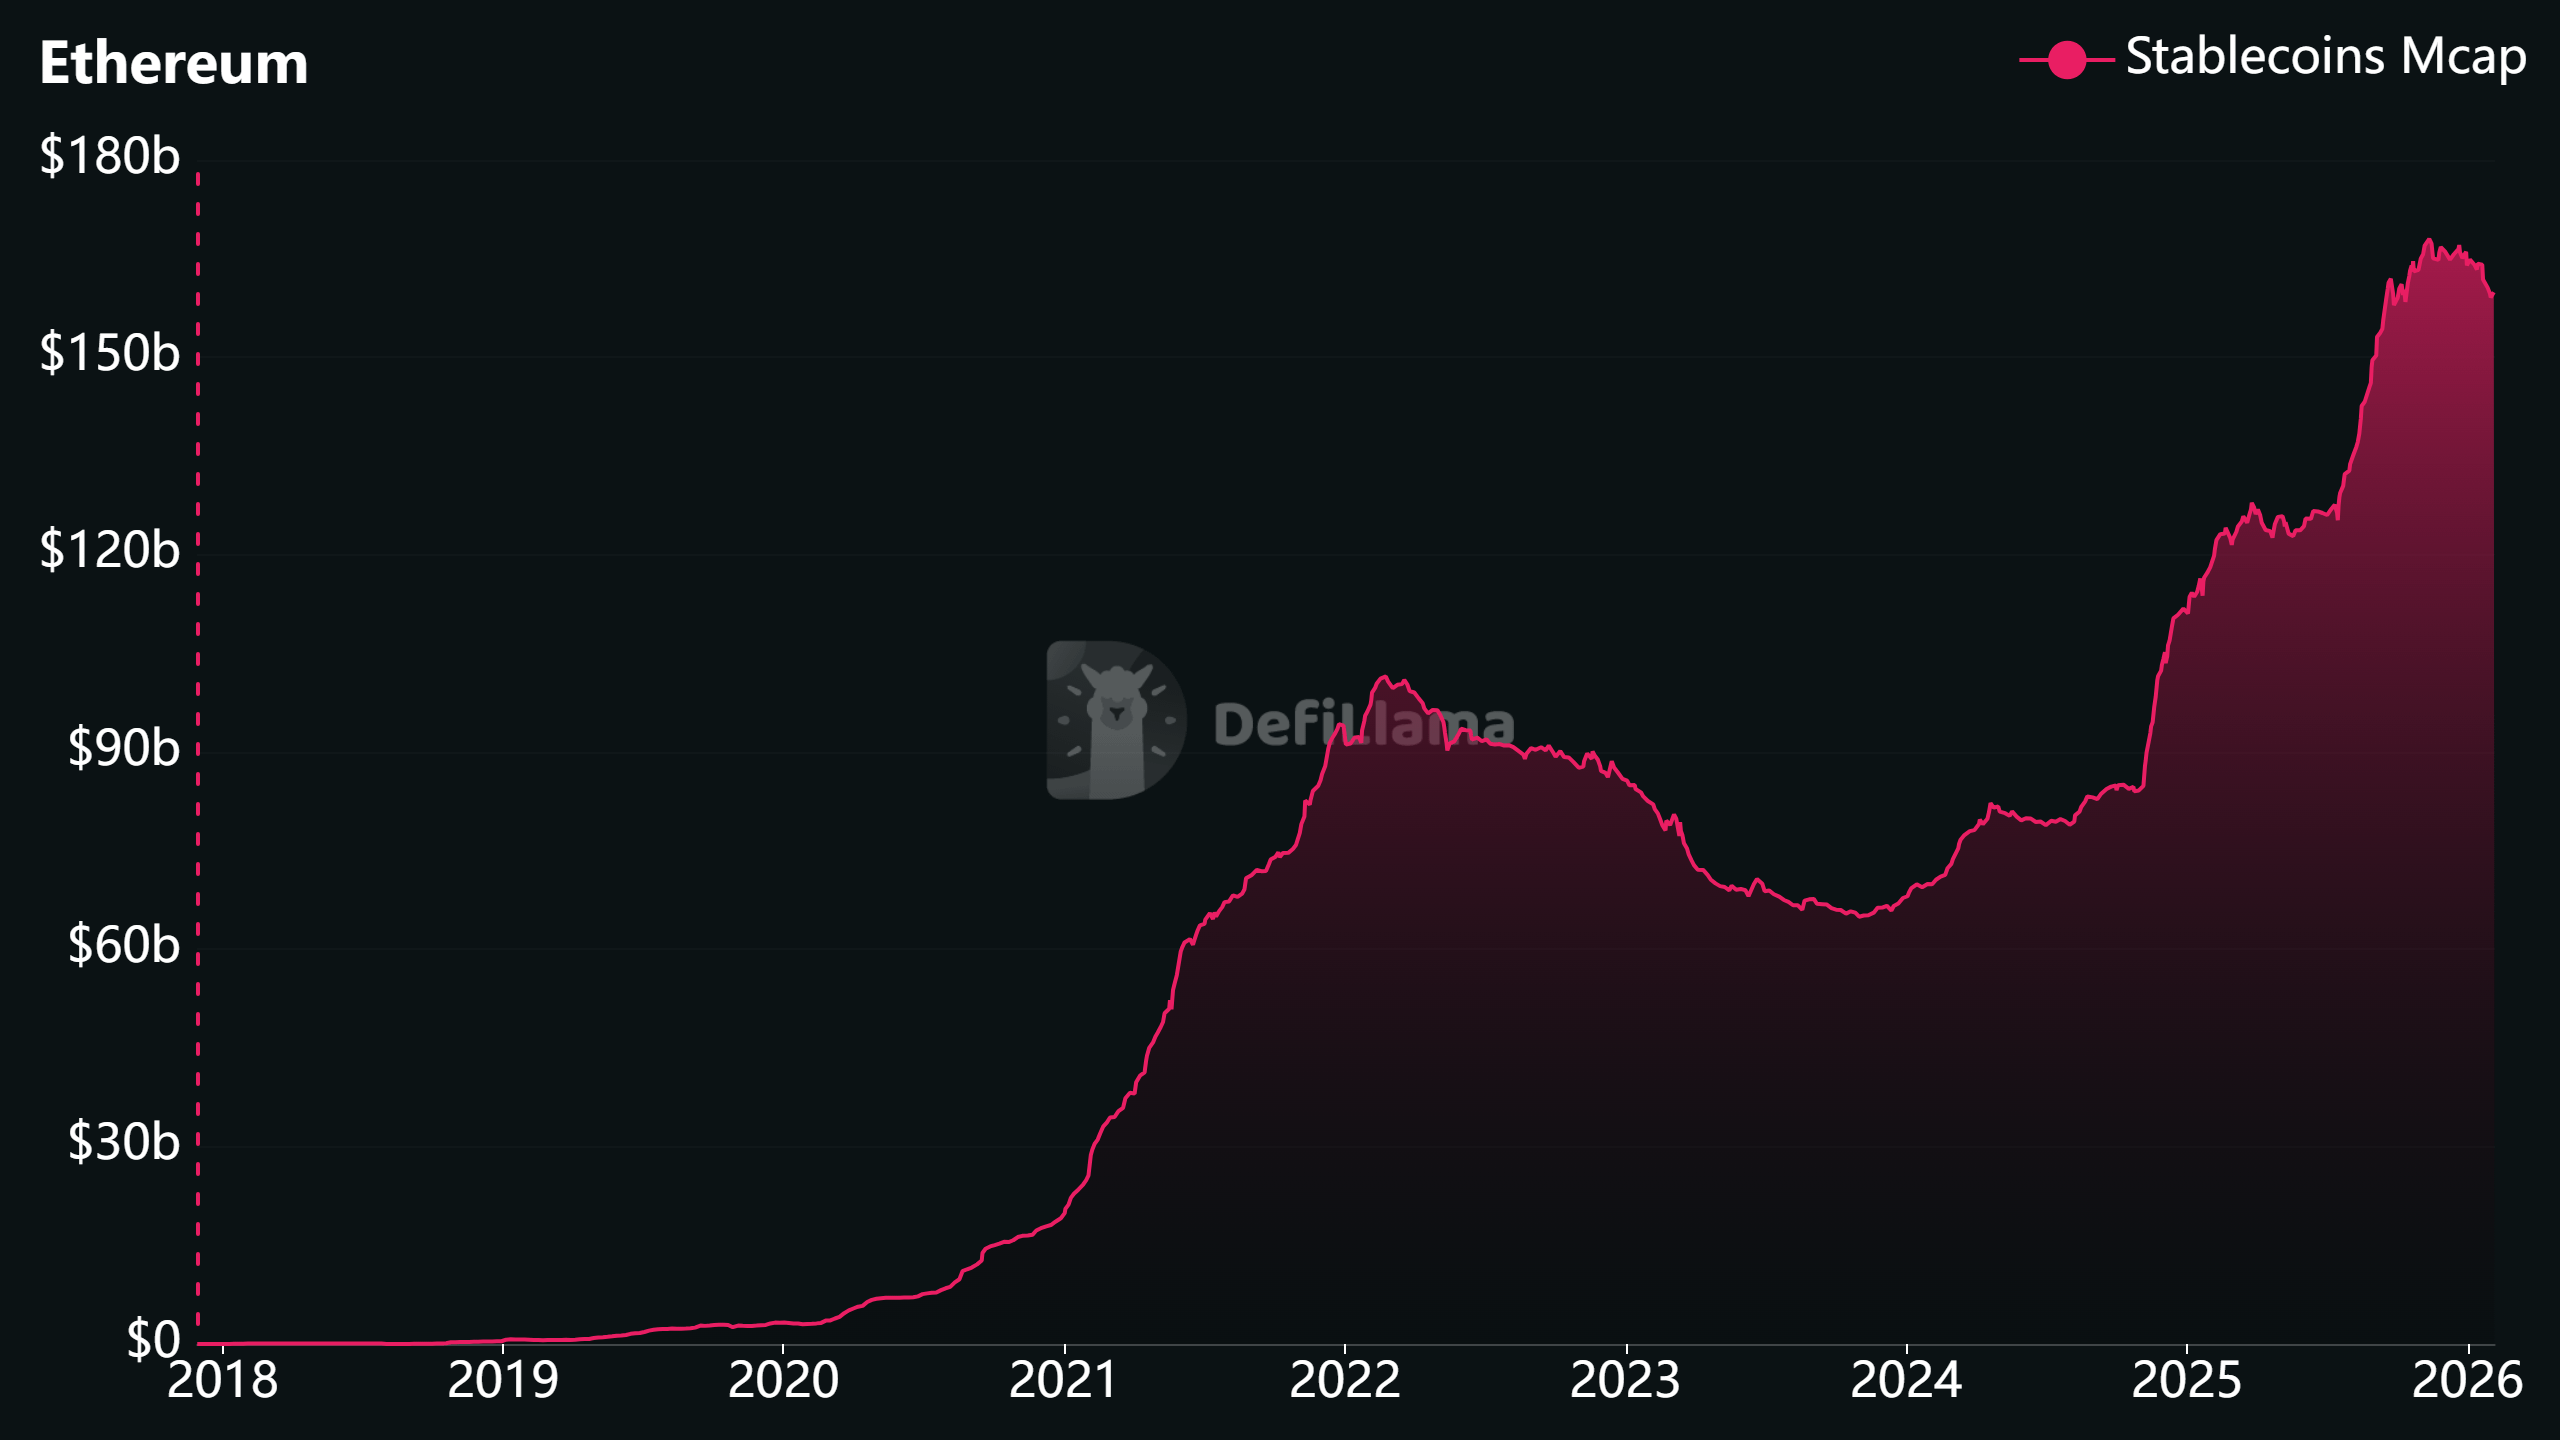
Ethereum still dominates stablecoins and tokenized Treasury assets, but low fee burn has led some traditional finance analysts to question how much value the base layer captures in the short term.
Social and narrative sentiment around ETH remains generally positive, but its price still moves mainly with Bitcoin.
________________________________
How the cycle works today
Bitcoin cycles used to be shaped mostly by the four year halving schedule. That pattern is weaker now because most Bitcoin has already been mined and the reduction in new supply is much smaller than in earlier years. This means demand and market structure matter more than the halving date.
ETFs and institutions have become major forces. Spot Bitcoin ETFs have taken in tens of billions of dollars since launch and now move price through creations and redemptions. Public companies also hold a meaningful share of total supply. Ethereum is following a similar path, with ETH ETFs, staking products and corporate treasuries growing in size.
Macro conditions are also central. The US dollar weakened through 2025 and global liquidity has been improving, which has usually helped risk assets. At the same time, Federal Reserve policy remains a key short term driver. Tightening pushes crypto risk premiums higher, while easing supports demand. In this environment, macro and ETF flows matter more than halving cycles.
_________________________________
Bitcoin cycle position
Bitcoin fell from its October 2025 peak after a strong rally driven by ETFs and macro conditions. Even after the correction, it is still far above the 2022 low. On chain valuation shows Bitcoin trading moderately above its cost basis, not extremely cheap and not extremely expensive.
Network usage is stable, but fees are very low. This suggests demand is present but speculative intensity is reduced. Holder behaviour shows that short term holders are close to break even and long term holders are mostly still in profit but are no longer selling aggressively.
Mid sized whales have reduced holdings, while very large holders and corporate treasuries have stayed fairly steady.
ETF flows were heavily negative into January, which matched falling prices and very weak sentiment. Recently, a large inflow appeared, which may signal a pause in the outflow trend. Social sentiment has swung to extreme fear, and narratives now focus on institutional adoption, currency weakness and skepticism about old cycle models.

Putting this together, Bitcoin looks more like it is in a mid to late cycle correction and reaccumulation zone rather than at a fresh peak or a deep bottom. Further downside is possible, but much of the excess from the previous rally has already been worked off.
_________________________________
Ethereum structure inside a Bitcoin led cycle
Ethereum shows strong usage but weak direct revenue. Transactions and active addresses are high, while fees and burn are low. Upgrades increased capacity and reduced costs, and most activity now happens on layer two networks.
Despite this, Ethereum’s supply structure is becoming tighter. Nearly half of ETH is staked, and large amounts are held by institutions and corporate treasuries. Staking queues remain long, showing steady demand to lock ETH rather than sell it.
Regulatory clarity and new products have made staking accessible to funds and asset managers.
Layer two networks now drive much of Ethereum’s growth. Some are profitable, while many generate little fee revenue. Ethereum still plays a central role in stablecoins and tokenized Treasuries, which ties it closely to real world financial use.
Sentiment around ETH is constructive. Many see accumulation by medium sized wallets, continued layer two growth and institutional adoption as positive signs.
At the same time, concerns remain about how much value the base layer captures when fees stay low. In the next few months, ETH is likely to follow Bitcoin’s path but with larger swings, supported by staking and real world usage.
__________________________________
Three possible paths over the next three to six months
Re accumulation and renewed advance
This path assumes a weak or stable dollar, improving liquidity, steady Federal Reserve policy and a return of consistent ETF inflows. On chain metrics would slowly improve without overheating.Bitcoin would grind higher from current levels and could challenge previous highs over time. Ethereum would likely outperform because of staking, layer two growth and ETF adoption.
Prolonged digestion
This path assumes mixed macro signals and ETF flows that move in and out without a strong trend. Bitcoin would trade in a wide range as valuation and activity stay near neutral levels.Ethereum would mostly track Bitcoin, with short rallies on network news that fade back into the range. Staking and real usage would provide support but not a strong push higher.
Deeper cyclical drawdown
This path assumes renewed macro stress or a new wave of ETF outflows. Bitcoin valuation would compress toward its cost basis and long term holders would begin selling at a loss more often. Usage and fees would likely fall further. Ethereum would probably fall more than Bitcoin in price terms, even though its structure remains strong.Right now, the data lean more toward the first two paths than toward an immediate deeper drawdown. ETF selling has already been heavy, valuation is moderate, and profit taking by long term holders has slowed. Macro conditions remain uncertain, so risk is still present.
_________________________________
What to watch going forward
For Bitcoin, the main things to monitor are valuation relative to realized price, behaviour of short and long term holders, changes in network fees and transactions, ETF inflows and outflows, and the direction of the dollar and global liquidity.
For Ethereum, the key points are the share of supply being staked, validator queues, institutional and corporate holdings, the balance between layer one and layer two economics, ETH ETF flows, and Ethereum’s role in stablecoins and tokenized assets.
_______________________________
Conclusion
From a cycle perspective, the current environment looks like a correction and reaccumulation phase within a market driven by institutions, ETFs and macro conditions. Bitcoin shows signs of meaningful cleansing after its 2025 peak but not of full capitulation.
Ethereum rests on strong structural foundations in staking, layer two usage and tokenized assets.
Whether a durable bottom is already in place will depend mainly on macro conditions and ETF flows. Much of the excess appears to have been removed, but the market remains sensitive to policy shifts and liquidity changes.
Tracking the indicators above provides a way to update this view over the next three to six months without relying on old halving based cycle models.