
The analysis from the picture shows that the current price movement tends to decline (downward):
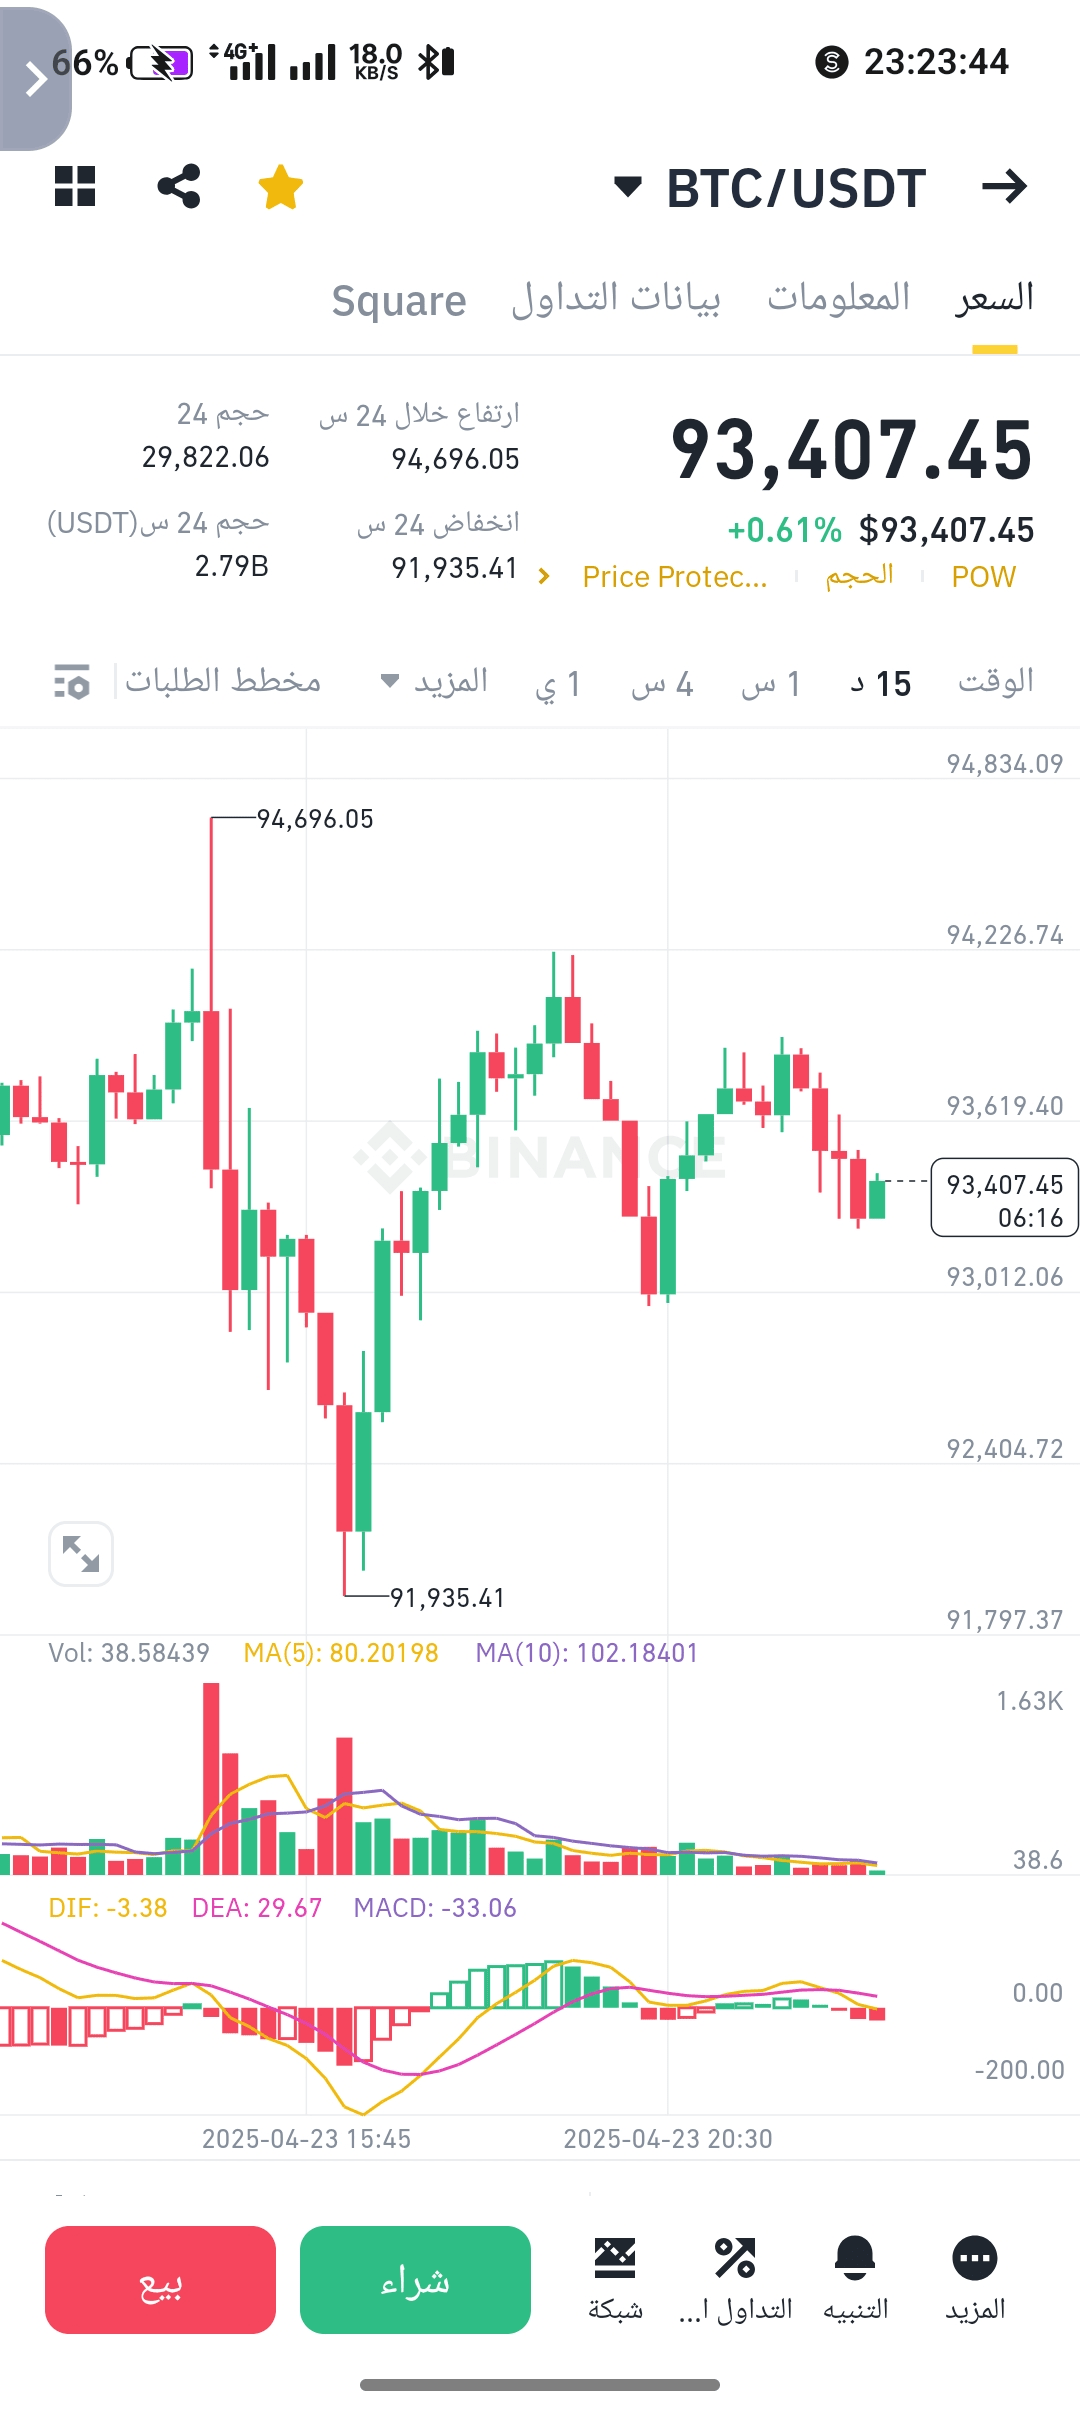
The recent trend of the candles: the last candles on the chart (15 minutes) show more red candles than green, indicating selling pressure.
Moving Averages (MACD): The MACD line is below the signal line (DEA), indicating negative signals.
Current price: the price is at 93,407.45, which is lower than the highest price in 24 hours (94,696.05) and closer to the lowest price (91,935.41).
However, the change is relatively small (+0.61%), which means the market is volatile, but the overall trend in the short term now seems to be downward.
To give you more accurate advice, let me clarify first that any trading decision depends on a clear strategy and risk management. But from the picture alone, I can offer you the following:
Current situation:
The price tends to decrease in the short term (downward trend).
MACD and DIF indicators are negative.
The price is slightly away from the highest point in 24 hours.
My advice:
If you are a trader (short-term trading):
Do not buy now, wait for a confirmation of trend reversal (e.g., strong green candles + MACD crossover upwards).
If you own BTC, you might sell a portion now and watch if the price drops further to buy back at a lower price.
If you are an investor (long-term):
You can consider any drop as an opportunity for gradual buying (in installments), but do not invest all your capital at once.
#CryptoMarketCapBackTo$3T #MarketRebound #BinanceAlphaAlert #TrumpVsPowell #USStockDrop