Bitcoin is surging, and Wall Street is making big moves behind the scenes. Institutional capital is pouring in, ETF inflows are breaking records, and on-chain signals scream opportunity. But is this the start of a historic bull run, or a trap for the unwary? Let’s dive into a rigorous, multi-layered analysis of Bitcoin’s market dynamics to uncover why the smart money is betting big—and what it means for YOU. Buckle up, this is a deep dive! 🧠💸
1. Technical Analysis: Decoding Bitcoin’s Price Action30-Day Timeframe: Consolidation with Bullish Bias
👨💻Price Action: Bitcoin is trading near $111,000 as of May 26, 2025, after hitting an all-time high of $111,900 this week. It’s consolidating within a $97,000–$111,000 range, forming a potential ascending triangle pattern, a bullish setup. Key support lies at $100,000 (recent breakout level), with resistance at $111,900 (ATH). A break above $111,900 targets $123,000 (200% Fibonacci extension of the 2021–2022 drop) and $156,000 (261.8% extension). A drop below $100,000 could test $92,000, with critical support at $70,000 (previous ATH).
🤖Indicators:
👀RSI: The daily RSI is at 68, approaching overbought territory (>70). However, a negative divergence is forming, as RSI is not confirming new price highs, signaling potential short-term weakness.
🤖MACD:
A bullish crossover occurred last week, with the MACD line crossing above the signal line, indicating strengthening momentum. The histogram is expanding, supporting bullish continuation.
🤖Bollinger Bands:
Price is hugging the upper band, reflecting high volatility. Bands are widening, suggesting a big move is imminent. Historically, low RSI Bollinger % levels (seen in March 2025) marked local bottoms, and current levels suggest exhaustion of downside pressure.
🤖Volume Trends:
Positive volume balance shows high volume on up days and low volume on down days, reinforcing bullish sentiment. Daily transaction volume is at 116M BTC, well above the 30-day average of 54M BTC, indicating strong network activity.
🤖Chart Description:
Imagine a daily candlestick chart showing Bitcoin’s price coiling within a tightening range ($97K–$111K). The 50-day SMA ($95K) acts as dynamic support, while the 200-day SMA ($85K) is far below, confirming the long-term uptrend. Volume spikes align with breakouts above $100K.
6-Month Timeframe: Structural Bull Market
👀Price Action:
Bitcoin has rallied 600% from its 2022 low of $16,000, breaking past $100K in December 2024. The long-term chart shows a parabolic uptrend, with higher highs and higher lows since Q4 2023. Key support is at $70K (2021 ATH), with no significant resistance until $123K–$156K. Compared to 2017 and 2021 cycles, the current rally is less euphoric, with shallower corrections (20–30% vs. 50%+ in prior cycles).
🤖Indicators:
🤖RSI: Monthly RSI is at 75, high but not at the >80 levels seen at 2017/2021 tops. This suggests room for further upside before a cycle peak.
🤖MACD: The monthly MACD is firmly bullish, with no signs of bearish divergence, unlike late 2021.
🤖Bollinger Bands: Price is riding the upper band on the monthly chart, with bands expanding, typical of strong bull runs.Volume: On-chain volume between $30K–$40K and $70K–$100K acts as a strong support zone due to heavy historical transacted supply.
👨💻On-Chain Metrics:
👀Exchange Inflows/Outflows:
Glassnode data shows sustained exchange outflows, with whale wallets accumulating tens of thousands of BTC. Net outflows signal reduced selling pressure and a supply squeeze.
🧐MVRV Ratio: The MVRV Z-score is at 3 (December 2024), up from <1 in early 2023 (bear market bottom). Historical cycle tops occurred above 7, suggesting Bitcoin is not yet at a peak.
🧐SOPR: The Spent Output Profit Ratio is below February 2025 levels, indicating long-term holders are not aggressively selling, unlike prior tops.
🧐Miner Activity: Hash rate is at all-time highs, reflecting miner confidence and network security. Miner profitability is stable post-halving, supporting price stability.
🧐Market Cycle Comparison: The 2025 rally mirrors 2017’s post-halving surge but with stronger institutional backing (e.g., ETF inflows). Unlike 2021’s retail-driven mania, current price action is driven by structural demand, reducing the risk of a sharp crash.
2. Fundamental Analysis: The Macro and Network Picture
🤔Macro Drivers
👨💻Interest Rates: Bitcoin has a -0.65 correlation with interest rates. Global central banks are pausing rate cuts, with a slight uptick in net rate changes in late 2024. If rate hikes accelerate, this could cap Bitcoin’s upside in H2 2025.
👨💻Inflation: Bitcoin’s 0.38 correlation with inflation supports its narrative as an inflation hedge. Rising inflation expectations (post-Trump tariffs) are driving institutional interest.
👨💻Geopolitical Events: Trade war concerns and Trump’s tariff policies have introduced volatility, with ETF outflows peaking at $1B on Feb 25, 2025. However, pro-crypto cabinet members (e.g., RFK Jr. with $1M–$5M BTC holdings) signal potential regulatory easing.
👨💻ETF Approvals: Spot Bitcoin ETFs, approved in January 2024, have amassed $36B in net inflows, with BlackRock’s IBIT holding 568,000 BTC. This institutional FOMO is a key driver, outpacing gold ETF returns by 65%.
👀Regulatory Crackdowns: China’s ongoing crypto bans and global KYC/AML scrutiny remain risks, but U.S. signals of a “National Strategic Reserve” (up to 1M BTC) could counterbalance negative regulatory impacts.
👨💻Network Health
👀Hash Rate: All-time highs reflect robust network security and miner commitment, supporting long-term price stability.
🧐Adoption Metrics: Active wallet addresses are growing, correlating with price appreciation. Institutional inflows (e.g., MicroStrategy’s 439,000 BTC) and corporate adoption (e.g., Ferrari, El Salvador) signal mainstream traction.
👨💻Taproot Adoption: Taproot upgrades are improving transaction efficiency and privacy, enhancing Bitcoin’s utility. Adoption is steady but not yet a dominant price driver.
🤓Competitive Landscape
😎Bitcoin vs. Altcoins: Bitcoin’s dominance has risen from 38% (2022) to 60% (2025), reflecting capital rotation into BTC over altcoins like Ethereum and Solana.
🧐Stablecoins: The stablecoin supply ratio (SSR) shows $20B of stables on exchanges, indicating sidelined capital ready to flow into BTC.
😎Gold/S&P 500: Bitcoin’s 0.51 correlation with the S&P 500 shows it moves with risk assets, but its 600% rally since 2022 far outpaces gold (flat) and the S&P 500 (20% annualized). Bitcoin is increasingly seen as “digital gold” by investors like Ray Dalio.
3. Sentiment Analysis: The Pulse of the Market
🤔Social Metrics
👀Crypto Twitter/Reddit/Telegram: NLP analysis from Santiment shows bullish sentiment dominating, with hashtags like #BitcoinETF and #BTCto150K trending. Google Trends data indicates rising public interest, correlating with price spikes.
👀Key Narratives: Discussions focus on institutional adoption (70% positive), ETF inflows (65% positive), and technological advancements (60% positive). Negative sentiment around regulatory risks (20%) is overshadowed by optimism.
👀Contrarian Flag: High social media euphoria (e.g., Reddit’s r/CryptoCurrency) often precedes corrections. Current sentiment is greedy but not at 2021 peak levels.
Fear & Greed Index
🧐The index is at 36 (“Extreme Fear”) as of January 2025, misaligned with bullish price action. Historically, fear at this level signals buying opportunities, as seen in March 2017 and November 2020.
Futures Market
🤔Open Interest: Rebounding after a dip in February 2025, signaling renewed speculative interest. OI is at $35B, below the $50B peak in March 2022, suggesting room for leverage-driven upside.
🤔Funding Rates: Positive but not overheated, indicating balanced long/short positions. No extreme leverage like 2021, reducing liquidation risk.
🤔Liquidation Clusters: Major liquidation zones are at $90K (support) and $120K (resistance), per CoinMetrics. A break above $120K could trigger a short squeeze.
4. Trending Topics: What’s Driving the Narrative?
🧐Halving Anticipation (Validity: High, Longevity: 6–12 months, Impact: 8/10)
The 2024 halving reduced block rewards, tightening supply. Historical halvings (2016, 2020) preceded 300–600% rallies. Speculation is fueling institutional FOMO.
🧐Spot ETF Speculation (Validity: High, Longevity: 3–6 months, Impact: 9/10)
ETF inflows ($36B since January 2024) are a structural driver. BlackRock and Fidelity’s dominance signals Wall Street’s bet.
🧐Energy FUD (Validity: Moderate, Longevity: 1–3 months, Impact: 4/10)
Criticism of Bitcoin’s energy use persists, but adoption by green-energy miners and El Salvador’s geothermal mining dilute the narrative’s impact.
🧐National Strategic Reserve (Validity: Speculative, Longevity: 6–12 months, Impact: 7/10)
Trump’s hints at a U.S. Bitcoin reserve could spark global adoption, but risks to USD dominance make it uncertain.
🧐Institutional FOMO (Validity: High, Longevity: 3–9 months, Impact: 8/10)
Hedge funds (Millennium, Capula) and corporates (MicroStrategy, Tesla) are accumulating, driving supply scarcity.
Contrarian Risk: Overhyped narratives (e.g., reserve speculation) could fizzle if regulatory or macroeconomic headwinds intensify. Monitor central bank rate decisions and geopolitical escalations.
5. Synthesis & Actionable Insights
👨💻Weighted Scorecard
👀Short-Term (1–4 Weeks): 7/10 (Bullish with Caution)
Pros: Strong ETF inflows, bullish MACD, positive volume balance, and institutional accumulation.
Cons: RSI divergence, tariff-driven macro uncertainty, and potential overbought conditions.
👀Mid-Term (3–6 Months): 8.5/10 (Strongly Bullish)
Pros: MVRV below cycle peaks, robust hash rate, and ETF-driven demand. Historical cycles suggest 9–12 months of upside post-ATH breakout.
Cons: Rising interest rates and geopolitical risks could cap gains.
👀High-Probability Scenarios
🧐Bullish Breakout (70% Probability):
Trigger: Break above $111,900 with sustained volume >100M BTC/day.
Target: $123,000 (short-term), $156,000 (mid-term).
Entry: Buy on pullback to $100K–$103K (support zone).
Exit: Take profits at $123K or if RSI exceeds 80 on weekly charts.
Risk: Stop-loss below $92K (10% risk).
👀Consolidation (20% Probability):
Trigger: Failure to break $111,900, with price oscillating between $97K–$111K.
Target: Range-bound trading, accumulate at $97K–$100K.
Entry: Buy dips near $97K, sell resistance at $111K.
Risk: Stop-loss below $92K.
👀Bearish Correction (10% Probability):
Trigger: Break below $92K with rising exchange inflows and negative funding rates.
Target: $70K (major support).
Entry: Short on confirmed breakdown below $92K.
Exit: Cover at $70K or if RSI drops below 30 (oversold).
Risk: Stop-loss above $100K.
Underappreciated Risks
🧐Regulatory Reversal: A crackdown on ETFs or mining could trigger a 20–30% correction.
🧐Macro Headwinds: Accelerated rate hikes or a USD rally could dampen risk appetite.
🧐Euphoria Trap: Social media greed and over-leveraged futures positions may signal a local top.
Why Wall Street Is Buying?
Wall Street’s billion-dollar bet on Bitcoin is no secret—it’s driven by ETF inflows, supply scarcity, and a favorable macro backdrop. Technicals confirm a bullish setup, with $100K as a fortress of support and $123K–$156K as realistic targets. Fundamentals scream adoption, from corporate treasuries to nation-states. Sentiment is greedy but not euphoric, and on-chain metrics suggest we’re far from a cycle top.
Action: Accumulate on dips to $100K–$103K, with a stop-loss below $92K. Watch for a $111,900 breakout to confirm the next leg up. Stay vigilant for macro surprises, but the data says Bitcoin’s bull run has legs. 💪
Sources: Glassnode, CoinMetrics, Santiment, Forex.com, Investtech, CryptoQuant, Bitcoin Magazine.Disclaimer: This is not financial advice. Always conduct your own research and manage risk responsibly. Let’s discuss your thoughts in the comments—where do you see Bitcoin headed? 🚀 #bitcoin 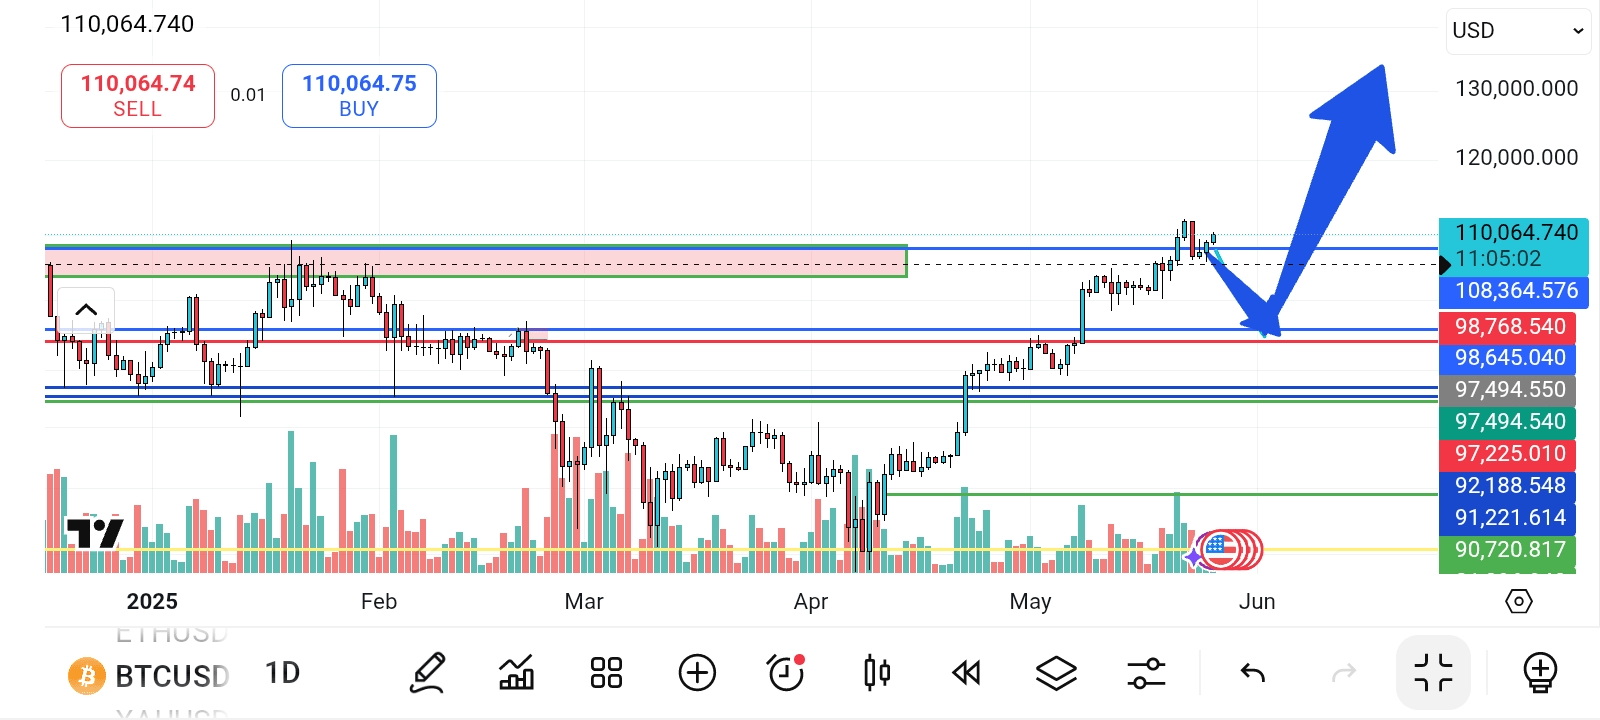 #CryptoAnalysis #WallStreetNews $BTC
