
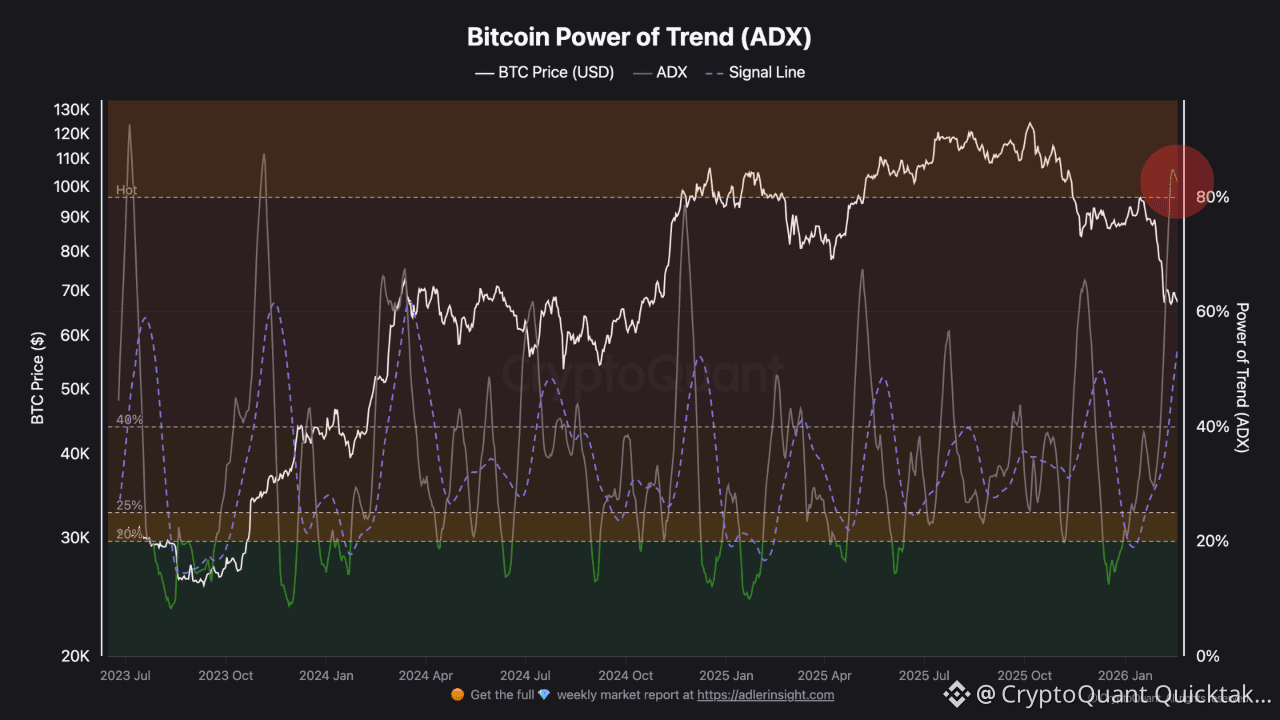
ADX just pushed into the ~80% zone. This indicator doesn't tell you direction. It tells you how strong the current trend is.
What does that mean? The trend is most likely already exhausted.
📊 What ADX Does
Simple: it measures trend strength. High = strong trend. Extreme = trend likely peaking. It doesn't care if we're going up or down, it just tells you how aggressive the move has been.
Current reading at ~80% is the highest zone. Historically unsustainable.
🔍 The Pattern
Every time ADX has pushed into this extreme zone, the trend that brought it there was already done. Not about to be done. Already done.
Late 2018 capitulation, COVID crash in 2020, FTX-era selling in 2022. Every time ADX screamed this loud, it recoiled. Every time, a new trend followed.
ADX needs to come back down and reload before the next significant trend can emerge. Direction doesn't matter. The indicator is agnostic.
💬 My Take
I keep seeing the bear market debate everywhere. Honestly? I don't care. Bear, bull, those words mean different things to every person in this market. It's not an exact science.
What I care about is this: is the selling pressure exhausting itself? ADX at 80% after a sharp downtrend says yes, probably.
But "probably" and "definitely" are very different words.
The 80-to-60 range on ADX looks small. In a mean reversion environment, that range is where squeezes live. Choppy price action that tests your patience and plays with your mind before the next real move shows up.
⏳ What This Doesn't Guarantee
Does this mean reversal? Not necessarily. Mean reversion can grind for weeks. ADX doesn't tell you which direction fires next, and exhaustion doesn't equal bottom. What it tells you is the current trend ran out of fuel.
Current setup: strongest downtrend reading on this chart. Trend strength exhausting.
The indicator reloads. Then it fires again. Which direction, that's the question none of us can answer yet.
Written by RugaResearch